George’s Latest TS Software
George continues to develop practical tools that work alongside TradeStation and MultiCharts while remaining outside the closed TradeStation ecosystem.
Get free Mean Reversion Systems in ELD and workspace for demonstration purposes. These systems were released in mid 2018. Here is the manual.
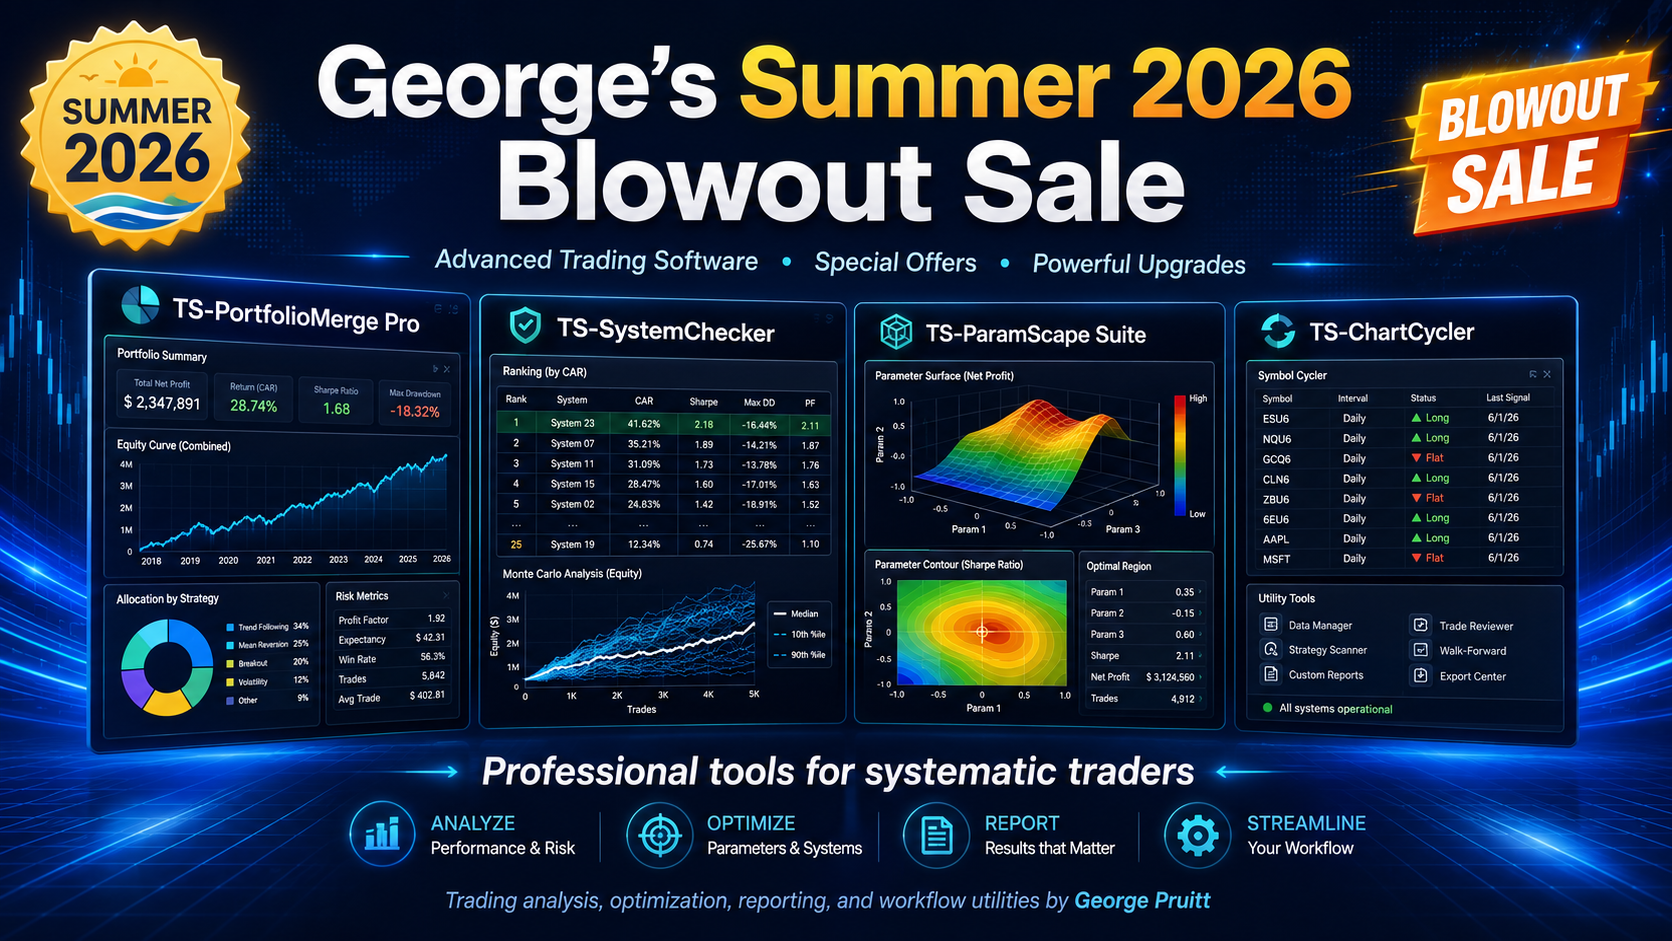
His latest release, TS-SystemChecker, brings the same ease of use found in TS-PortfolioMerge and TS-ParamScape, while adding powerful new tools for incubation analysis, Monte Carlo testing, and system-health evaluation.

TS-SystemChecker

Video to using TS-SystemChecker
Manual:
Most trading systems don’t fail overnight.
They drift. They degrade. They behave just differently enough to make you question everything.
The real problem isn’t performance.
It’s uncertainty.
TS-SystemChecker was built to answer one critical question:
Is this system still behaving within expectations… or is it broken?
A Tool Built for the Real World
This isn’t a system builder.
It’s not a curve-fitting engine.
And it’s definitely not a black box.
TS-SystemChecker is designed to help you evaluate what you already have—with clear, objective metrics that cut through the emotional fog of trading.
Two Modes. One Purpose: Clarity.
Incubation Analysis
Understand how your system is performing right now compared to its historical behavior.
-
Expected vs Actual Performance’
-
Drawdown Stress Analysis
-
Monthly Equity Correlation
-
Baseline Projection vs Reality
-
Incubation Readiness Score
Answer the question:
Is this normal… or is something wrong?
Monte Carlo Analysis
See the range of possible futures your system could experience.
-
Forward Equity Distributions
-
Drawdown Percentiles
-
Risk of Ruin Analysis
-
Median vs Worst-Case Outcomes
-
Efficiency Cloud
Answer the question:
What kind of risk am I really taking?
The Problem Most Traders Face
You launch a system.
It starts underperforming.
Now you’re stuck between two bad decisions:
-
Shut it down too early
-
Stick with it too long
TS-SystemChecker gives you a third option:
Make the decision based on data.
What Makes This Different
Most tools tell you how a system performed in the past.
TS-SystemChecker tells you:
-
Whether your current performance is statistically acceptable
-
Whether your drawdowns are within expected bounds
-
Where your results fall inside a range of realistic outcomes
It replaces guesswork with measurable context.
Designed for How Traders Actually Work
-
Import trade data from TradeStation’s Report in Excel format
-
Combine multiple systems
-
Define your “go live” date
-
Analyze instantly
No platform lock-in.
Works alongside TradeStation, MultiCharts, or any trading workflow.
Clear, Actionable Conclusions
Every analysis leads to a structured assessment:
-
Ready to Go
-
Mixed Performance
-
Degraded
-
Broken
Along with a quantified:
-
Risk Assessment
-
Incubation Readiness Score
No ambiguity. No interpretation gymnastics.
Built From Experience
After decades of evaluating trading systems—both good and bad—I needed a way to separate:
-
Normal variation
from -
Real deterioration
TS-SystemChecker is that framework.
Stop Guessing
You don’t need another system.
You need to understand the ones you already have.
TS-SystemChecker gives you that clarity.


Let TS-SystemChecker put it in its own words:
Incubation Assessment
- Overall Assessment: Degraded
- Risk Assessment: Critical Risk
- Incubation Readiness Score: 4 / 8
Return delivery is running ahead of baseline: expected annual return is 36% versus actual annual return of 68%, and expected annual gain of $4,477 compares with actual annual gain of $8,536. However, that stronger return delivery has come with a less stable path and/or materially heavier risk than history would suggest. Risk is materially worse than the historical profile: actual worst drawdown of $18,588 is 2.670 times the historical drawdown of $6,962. Risk conditions
are now in the Critical Risk range. The realized monthly path is no longer tightly aligned with the baseline, based on monthly equity correlation of 0.960, projection RMSE of $21,789, and normalized RMSE of 4.867. Monte Carlo context is cautionary: actual forward equity is $67,575, gain percentile is 96% (near the top of the simulated distribution), and drawdown percentile is 99% (in the worst decile for drawdown stress). Taken together, the system shows meaningful deterioration in incubation