In today’s trading environment where a single stock dominates an index, you must be careful with your order placement (if you can) around potentially large news events.
I am late with this post, but my client (I program for him) suffered through a Perfect Slippage Storm. A short-term system is only as good as its ability to be properly executed. On August 27th, 2025, NVIDIA announced after the market close. According to ChatGPT.
Yes—that timing lines up with Nvidia’s earnings release hitting after the bell. On Wed, Aug 27, 2025, outlets were primed for the NVDA press release around 4:20 pm ET; live blogs called out that exact time window, and NVDA headlines/press release started landing shortly after, with shares dipping in early after-hours. That kind of instant move in NVDA typically ripples straight into NQ.
Check out the following graphic.
The Perfect Slippage Storm!
Can this really happen?
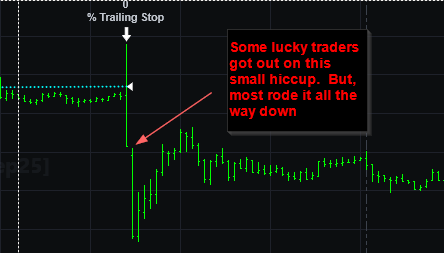
Come on – this is a 5-minute bar, right? A lot of things can happen in five minutes. I was a futures broker for many years and my rule of thumb during my tenure was you MAY get out at the low of the minute bar if there is a hiccup and your sell stop is blown. Here is a one-minute chart.
Some orders were filled at the tick up on the 2nd minute bar.
My client wasn’t lucky this day and got filled near the low of the 2nd minute bar. He was using a % trailing stop and when the high breached his threshold his protective stop was cancelled, and the new stop was implemented. All this activity takes time. And this strategy is professionally managed.
Why was this a perfect storm?
The report pop printed a new intraday high, likely tripping resting buy-stops and in this case pulling trailing protective stops tighter. Those sell-stops then fired into a thinning book after 4:00 p.m. ET, where Nasdaq futures liquidity is razor thin. Some orders were rejected or re-priced and ended up converting to market, worsening slippage. In this case, my client would have been better off if the trailing-stop threshold hadn’t been touched.
Electronic Trading and Fast Market Conditions and Not Held Order!
You believed the trade was up $400, but your day-end statement shows a loss of –$3,400. That disconnect usually comes from execution during a fast market. When your order is not held, the broker (or algo) has time/price discretion and no obligation to fill at a specific price. In a sudden air-pocket, quotes vanish and price gaps; the broker can’t predict the next print, so the only thing he can do is hit the first available liquidity. The result is slippage and a gaping difference between what is on the screen on what is in your pocket or the lack thereof.
A Stop Limit order can help during spikes or down drafts
This type of order is not universally available – especially when using algos.
A buy stop-limit order is a two-part order used to enter long above the market (or cover a short) with price control.
Stop price (trigger): When the market trades at or above this price, your order activates.
Limit price (cap): Once activated, the order becomes a limit buy at your limit price (or better). It will not pay more than the limit.
What should my client do in the future?
He tested his strategy over 15 years of data and felt secure enough to trade the system. He knows that this market action could have just as easily gone in his favor. Had the initial reaction carried on, he may have made a nice profit. Should he augment his strategy to get out at the end of the day and then get back in – step over post-closing reports? Maybe, but there is always the potential of slippage on this out and back in trade. Also, you would need to use discretion as to when a handful of stocks controls the entire index.
Percent trailing stops only help if your profit trigger is meaningfully large and you’re willing to give back a realistic slice of that profit.
When a client shows me an equity curve that looks too good to be true, my first question is whether they’re using a percent trailing stop. I hope they say no—but usually it’s yes. Then I ask two things:
What’s the profit threshold that arms the trail?
How much are you willing to give back once it arms?
If the threshold is small and the give-back is ~20% or less, I know we’re in Best-Case Scenario Syndrome: backtests assume friendly fills. Platforms like TradeStation or MultiCharts will print a theoretical fill on every trade, but as we saw earlier, the gap between theory and actual can be huge.
You must accept that slippage is going to occur
If you don’t then you cannot trade. You might come back at me and say: “Well, I will only use stop limit orders.” That is great. but what about when exiting a trade. “I will only develop a strategy that enters on limits – that way I can cut slippage in half.” That is definitely a possibility. “I will execute myself and forgo the convenience of algo order placement.” Well, you better quit your day job and trade during the day.
Simple Donchian on a one contract basis. $100 Commission/slippage. Tested from 2000 thru December 31, 2021. Do you see why most trend followers failed after the 2008 monstrous year. Many funds caught the 2008 move and more funds were added soon thereafter. Promises of similar performance came to fruition in 2011. This kept much of the “new money” on the board. However, reality set in and weak handed funds left for greener pastures. Those that stuck it out were rewarded in 2014. The trend drought of 2014 -2019 eroded most of the confidence in managed futures. The rationalization that limited resources would eventually rise in price sounded good initially, but then fell on deaf ears after months of draw down. Well known CTAs and hedge funds shut their doors forever. The long awaited promise of 2008 came in the form of a pandemic – but it was too late. Maybe now the deluge that ended the drought will persevere (hopefully not in the form of a pandemic) into the future. Prices do not need to rise endlessly, but they need to move one direction or another without many hiccups.
Simple Donchian Caught Most of the Commodities Up Moves
Which Sectors Pushed this Curve through the Roof
These reports were generated by my Python based Trading Simula-18 using Pinnacle continuous data – rollover triggered by date. This is my new sector analysis report where I graph the last four years performance. The tabular data is for the entire 21 year history. The best sectors were energy, grains, financials and metals. Lumber was extraordinary
Here is the module for TS-18. There is a little extra code to keep track of sectors in case you want to limit sector exposure. However, this code takes every trade on a one contract basis. This code reflects my latest version of TS-18, which will be released shortly.
# Define Long, Short, ExitLong and ExitShort Levels - mind your indentations buyLevel = highest(myHigh,40,curBar,1) shortLevel = lowest(myLow,40,curBar,1) longExit = lowest(myLow,20,curBar,1) shortExit = highest(myHigh,20,curBar,1) ATR = sAverage(myTrueRange,30,curBar,1) stopAmt = 2000/myBPV
# Long Exit if mp == 1 and myLow[curBar] <= mmLxit and mmLxit > longExit and barsSinceEntry > 1: price = min(myOpen[curBar],mmLxit) tradeName = "LxitMM" numShares = curShares exitPosition(price, curShares, tradeName, sysMarkDict) unPackDict(sysMarkDict) # Long Exit if mp == 1 and myLow[curBar] <= longExit and barsSinceEntry > 1: price = min(myOpen[curBar],longExit) tradeName = "Lxit" numShares = curShares exitPosition(price, curShares, tradeName, sysMarkDict) unPackDict(sysMarkDict) # Short Exit if mp == -1 and myHigh[curBar] >= shortExit and barsSinceEntry > 1: price = max(myOpen[curBar],shortExit) tradeName = "Sxit" numShares = curShares exitPosition(price, curShares, tradeName, sysMarkDict) unPackDict(sysMarkDict) # Short Exit if mp == -1 and myHigh[curBar] >= entryPrice[-1] + stopAmt and barsSinceEntry > 1: price = max(myOpen[curBar],entryPrice[-1] + stopAmt) tradeName = "SxitMM" numShares = curShares exitPosition(price, curShares, tradeName,sysMarkDict) unPackDict(sysMarkDict) # Long Entry if myHigh[curBar] >= buyLevel and mp !=1: price = max(myOpen[curBar],buyLevel) tradeName = "Simple Buy" numShares = posSize enterLongPosition(price,numShares,tradeName,sysMarkDict) unPackDict(sysMarkDict) # Short Entry if myLow[curBar] <= shortLevel and mp !=-1 : price = min(myOpen[curBar],shortLevel) if mp == 0 : sectorTradesTodayList[curSector] +=1 tradeName = "Simple Sell" numShares = posSize enterShortPosition(price, numShares, tradeName, sysMarkDict) unPackDict(sysMarkDict)
Python within Trading Simula-18
Backtesting with [Trade Station,Python,AmiBroker, Excel]. Intended for informational and educational purposes only!
Get All Five Books in the Easing Into EasyLanguage Series - The Trend Following Edition is now Available!
Announcement – A Trend Following edition has been added to my Easing into EasyLanguage Series! This edition will be the fifth and final installment and will utilize concepts discussed in the Foundation editions. I will pay respect to the legends of Trend Following by replicating the essence of their algorithms. Learn about the most prominent form of algorithmic trading. But get geared up for it by reading the first four editions in the series now. Get your favorite QUANT the books they need!
The Foundation Edition. The first in the series.
This series includes five editions that covers the full spectrum of the EasyLanguage programming language. Fully compliant with TradeStation and mostly compliant with MultiCharts. Start out with the Foundation Edition. It is designed for the new user of EasyLanguage or for those you would like to have a refresher course. There are 13 tutorials ranging from creating Strategies to PaintBars. Learn how to create your own functions or apply stops and profit objectives. Ever wanted to know how to find an inside day that is also a Narrow Range 7 (NR7?) Now you can, and the best part is you get over 4 HOURS OF VIDEO INSTRUCTION – one for each tutorial.
Hi-Res Edition Cover
This book is ideal for those who have completed the Foundation Edition or have some experience with EasyLanguage, especially if you’re ready to take your programming skills to the next level. The Hi-Res Edition is designed for programmers who want to build intraday trading systems, incorporating trade management techniques like profit targets and stop losses. This edition bridges the gap between daily and intraday bar programming, making it easier to handle challenges like tracking the sequence of high and low prices within the trading day. Plus, enjoy 5 hours of video instruction to guide you through each tutorial.
Advanced Topics Cover
The Advanced Topics Edition delves into essential programming concepts within EasyLanguage, offering a focused approach to complex topics. This book covers arrays and fixed-length buffers, including methods for element management, extraction, and sorting. Explore finite state machines using the switch-case construct, text graphic manipulation to retrieve precise X and Y coordinates, and gain insights into seasonality with the Ruggiero/Barna Universal Seasonal and Sheldon Knight Seasonal methods. Additionally, learn to build EasyLanguage projects, integrate fundamental data like Commitment of Traders, and create multi-timeframe indicators for comprehensive analysis.
Get Day Trading Edition Today!
The Day Trading Edition complements the other books in the series, diving into the popular approach of day trading, where overnight risk is avoided (though daytime risk still applies!). Programming on high-resolution data, such as five- or one-minute bars, can be challenging, and this book provides guidance without claiming to be a “Holy Grail.” It’s not for ultra-high-frequency trading but rather for those interested in techniques like volatility-based breakouts, pyramiding, scaling out, and zone-based trading. Ideal for readers of the Foundation and Hi-Res editions or those with EasyLanguage experience, this book offers insights into algorithms that shaped the day trading industry.
Trend Following Cover.
For thirty-one years as the Director of Research at Futures Truth Magazine, I had the privilege of collaborating with renowned experts in technical analysis, including Fitschen, Stuckey, Ruggiero, Fox, and Waite. I gained invaluable insights as I watched their trend-following methods reach impressive peaks, face sharp declines, and ultimately rebound. From late 2014 to early 2020, I witnessed a dramatic downturn across the trend-following industry. Iconic systems like Aberration, CatScan, Andromeda, and Super Turtle—once thriving on robust trends of the 1990s through early 2010s—began to falter long before the pandemic. Since 2020 we have seen the familiar trends return. Get six hours of video instruction with this edition.
Pick up your copies today – e-Book or paperback format – at Amazon.com