
Why Can’t I Just Test with Daily Bars and Use Look-Inside Bar?
Good question. You can’t because it doesn’t work accurately all of the time. I just default to using 5 minute or less bars whenever I need to. A large portion of short term, including day trade, systems need to know the intra day market movements to know which orders were filled accurately. It would be great if you could just flip a switch and convert a daily bar system to an intraday system and Look Inside Bar(LIB) is theoretically that switch. Here I will prove that switch doesn’t always work.
Daily Bar System
- Buy next bar at open of the day plus 20% of the 5 day average range
- SellShort next at open of the day minus 20% of the 5 day average range
- If long take a profit at one 5 day average range above entryPrice
- If short take a profit at one 5 day average range below entryPrice
- If long get out at a loss at 1/2 a 5 day average range below entryPrice
- If short get out at a loss at 1/2 a 5 day average range above entry price
- Allow only 1 long and 1 short entry per day
- Get out at the end of the day
Simple Code for the System

Looks great with just the one hiccup: Bot @ 3846.75 and the Shorted @ 3834.75 and then took nearly 30 handles of profit.
Now let’s see what really happened.

Intraday Code to Control Entry Time and Number of Longs and Shorts
Not an accurate representation so let’s take this really simple system and apply it to intraday data. Approaching this from a logical perspective with limited knowledge about TradeStation you might come up with this seemingly valid solution. Working on the long side first.
This looks very similar to the daily bar system. I cheated a little by using
if d <> d[1] then value1 = .2 * average(Range of data2,5);
Here I am only calculating the average once a day instead of on each 5 minute bar. Makes things quicker. Also I used
if t > sess1StartTime then buy next bar at openD(0) + value1 stop;
I did that because if you did this:
buy next bar at open of next bar + value1 stop;
You would get this:

That should do it for the long side, right?

So now we have to monitor when we can place a trade and monitor the number of long and short entries.
How does this look!

So here is the code. You will notice the added complexity. The important things to know is how to control when an entry is allowed and how to count the number of long and short entries. I use the built-in keyword/function totalTrades to keep track of entries/exits and marketPosition to keep track of the type of entry.
Take a look at the code and you can see how the daily bar system is somewhat embedded in the code. But remember you have to take into account that you are stepping through every 5 minute bar and things change from one bar to the next.
Here’s a few trade examples to prove our code works.

Okay the code worked but did the system?

Conclusion
If you need to know what occurred first – a high or a low in a move then you must use intraday data. If you want to have multiple entries then of course your only alternative is intraday data. This little bit of code can get you started converting your daily bar systems to intraday data and can be a framework to develop your own day trading/or swing systems.
Can I Prototype A Short Term System with Daily Data?
You can of course use Daily Bars for fast system prototyping. When the daily bar system was tested with LIB turned on, it came close to the same results as the more accurately programmed intraday system. So you can prototype to determine if a system has a chance. Our core concept buyt a break out, short a break out, take profits and losses and have no overnight exposure sounds good theoretically. And if you only allow 2 entries in opposite directions on a daily bar you can determine if there is something there.
A Dr. Jekyll and Mr. Hyde Scenario
While playing around with this I did some prototyping of a daily bar system and created this equity curve. I mistakenly did not allow any losses – only took profits and re-entered long.

Venalicius Cave! Don’t take a loser you and will reap the benefits. The chart says so – so its got to be true – I know right?
The same chart from a different perspective.
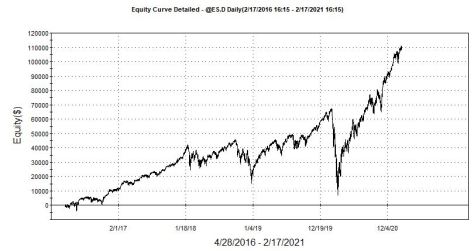
Moral of the Story – always look at your detailed Equity Curve. This curve is very close to a simple buy and hold strategy. Maybe a little better.


