Category Archives: Uncategorized

Videos Describing Free ES.D DayTrade System

Videos Published Explaining Code for the ES.D DayTrade (V-ORBO) Strategy

Two videos have been uploaded to youTube describing the strategy and strategy based indicator that I discussed in the prior post.  Here is todays action (Friday 9th of April).

2021-04-09
Friday Action – Sometimes It Works

What’s In The Videos?

Getting the Shading of the Break Out Box requires some tweaking of the indicator properties.  Part A shows how to do this – remember the code is available in the prior post.  In Part B I break down the code and show I first was inspired to develop the indicator and then figured developing the strategy would help create the indicator.  I describe both sources in the Part B.

Here are the videos:

PART-A

PART-B

EasyLanguage Programming Workshop Part 1: 2D Array, Print Format, and Loops

Storing Trades for Later Use in a 2D Array

Since this is part 1 we are just going to go over a very simple system:  SAR (stop and reverse) at highest/lowest high/low for past 20 days.

A 2D Array in EasyLanguage is Immutable

Meaning that once you create an array all of the data types must be the same.  In a Python list you can have integers, strings, objects whatever.   In C and its derivatives you also have a a data structure (a thing that stores related data) know as a Structure or Struct.  We can mimic a structure in EL by using a 2 dimensional array.  An array is just a list of values that can be referenced by an index.

array[1] = 3.14

array[2] = 42

array[3] = 2.71828

A 2 day array is similar but it looks like a table

array[1,1], array[1,2], array[1,3]

array[2,1], array[2,2], array[2,3]

The first number in the pair is the row and the second is the column.  So a 2D array can be very large table with many rows and columns.  The column can also be referred to as a field in the table.  To help use a table you can actually give your fields names.  Here is a table structure that I created to store trade information.

  1. trdEntryPrice (0) – column zero – yes we can have a 0 col. and row
  2. trdEntryDate(1)
  3. trdExitPrice (2)
  4. trdExitDate(3)
  5. trdID(4)
  6. trdPos(5)
  7. trdProfit(6)
  8. trdCumuProfit(7)

So when I refer to tradeStruct[0, trdEntryPrice] I am referring to the first column in the first row.

This how you define a 2D array and its associate fields.

arrays: tradeStruct[10000,7](0);

vars: trdEntryPrice (0),
trdEntryDate(1),
trdExitPrice (2),
trdExitDate(3),
trdID(4),
trdPos(5),
trdProfit(6),
trdCumuProfit(7);
2D array and its Fields

In EasyLanguage You are Poised at the Close of a Yesterday’s Bar

This paradigm allows you to sneak a peek at tomorrow’s open tick but that is it.  You can’t really cheat, but it also limits your creativity and makes things more difficult to program when all you want is an accurate backtest.   I will go into detail, if I haven’t already in an earlier post, the difference of sitting on Yesterday’s close verus sitting on Today’s close with retroactive trading powers.  Since we are only storing trade information when can use hindsight to gather the information we need.

Buy tomorrow at highest(h,20) stop;

SellShort tomorrow at lowest(l,20) stop;

These are the order directives that we will be using to execute our strategy.  We can also run a Shadow System, with the benefit of hindsight, to see where we entered long/short and at what prices. I call it a Shadow because its all the trades reflected back one bar.   All we need to do is offset the highest and lowest calculations by 1 and compare the values to today’s highs and lows to determine trade entry.  We must also test the open if a gap occurred and we would have been filled at the open.  Now this code gets a bit hairy, but stick with it.

Shadow System

stb = highest(h,20);
sts = lowest(l,20);
stb1 = highest(h[1],20);
sts1 = lowest(l[1],20);

buy("Sys-L") 1 contract next bar at stb stop;
sellShort("Sys-S") 1 contract next bar at sts stop;

mp = marketPosition*currentContracts;
totTrds = totalTrades;

if mPos <> 1 then
begin
if h >= stb1 then
begin
if mPos < 0 then // close existing short position
begin
mEntryPrice = tradeStruct[numTrades,trdEntryPrice];
mExitPrice = maxList(o,stb1);
tradeStruct[numTrades,trdExitPrice] = mExitPrice;
tradeStruct[numTrades,trdExitDate] = date;
mProfit = (mEntryPrice - mExitPrice) * bigPointValue - mCommSlipp;
cumuProfit += mProfit;
tradeStruct[numTrades,trdCumuProfit] = cumuProfit;
tradeStruct[numTrades,trdProfit] = mProfit;
print(d+19000000:8:0," shrtExit ",mEntryPrice:4:5," ",mExitPrice:4:5," ",mProfit:6:0," ",cumuProfit:7:0);
print("-------------------------------------------------------------------------");
end;
numTrades +=1;
mEntryPrice = maxList(o,stb1);
tradeStruct[numTrades,trdID] = 1;
tradeStruct[numTrades,trdPOS] = 1;
tradeStruct[numTrades,trdEntryPrice] = mEntryPrice;
tradeStruct[numTrades,trdEntryDate] = date;
mPos = 1;
print(d+19000000:8:0," longEntry ",mEntryPrice:4:5);
end;
end;
if mPos <>-1 then
begin
if l <= sts1 then
begin
if mPos > 0 then // close existing long position
begin
mEntryPrice = tradeStruct[numTrades,trdEntryPrice];
mExitPrice = minList(o,sts1);
tradeStruct[numTrades,trdExitPrice] = mExitPrice;
tradeStruct[numTrades,trdExitDate] = date;
mProfit = (mExitPrice - mEntryPrice ) * bigPointValue - mCommSlipp;
cumuProfit += mProfit;
tradeStruct[numTrades,trdCumuProfit] = cumuProfit;
tradeStruct[numTrades,trdProfit] = mProfit;
print(d+19000000:8:0," longExit ",mEntryPrice:4:5," ",mExitPrice:4:5," ",mProfit:6:0," ",cumuProfit:7:0);
print("---------------------------------------------------------------------");
end;
numTrades +=1;
mEntryPrice =minList(o,sts1);
tradeStruct[numTrades,trdID] = 2;
tradeStruct[numTrades,trdPOS] =-1;
tradeStruct[numTrades,trdEntryPrice] = mEntryPrice;
tradeStruct[numTrades,trdEntryDate] = date;
mPos = -1;
print(d+19000000:8:0," ShortEntry ",mEntryPrice:4:5);
end;
end;
Shadow System - Generic forany SAR System

Notice I have stb and stb1.  The only difference between the two calculations is one is displaced a day.  I use the stb and sts in the EL trade directives.  I use stb1 and sts1 in the Shadow System code.  I guarantee this snippet of code is in every backtesting platform out there.

All the variables that start with the letter m, such as mEntryPrice, mExitPrice deal with the Shadow System.  Theyare not derived from TradeStation’s back testing engine only our logic.  Lets look at the first part of just one side of the Shadow System:

if mPos <> 1 then
begin
if h >= stb1 then
begin
if mPos < 0 then // close existing short position
begin
mEntryPrice = tradeStruct[numTrades,trdEntryPrice];
mExitPrice = maxList(o,stb1);
tradeStruct[numTrades,trdExitPrice] = mExitPrice;
tradeStruct[numTrades,trdExitDate] = date;
mProfit = (mEntryPrice - mExitPrice) * bigPointValue - mCommSlipp;
cumuProfit += mProfit;
tradeStruct[numTrades,trdCumuProfit] = cumuProfit;
tradeStruct[numTrades,trdProfit] = mProfit;
print(d+19000000:8:0," shrtExit ",mEntryPrice:4:5," ",mExitPrice:4:5," ",mProfit:6:0," ",cumuProfit:7:0);
print("-------------------------------------------------------------------------");
end;

mPos and mEntryPrice and mExitPrice belong to the Shadow System

if mPos <> 1 then the Shadow Systems [SS] is not long.  So we test today’s high against stb1 and if its greater then we know a long position was put on.  But what if mPos = -1 [short], then we need to calculate the exit and the trade profit and the cumulative trade profit.  If mPos = -1 then we know a short position is on and we can access its particulars from the tradeStruct 2D arraymEntryPrice = tradeStruct[numTrades,trdEntryPrice].  We can gather the other necessary information from the tradeStruct [remember this is just a table with fields spelled out for us.]  Once we get the information we need we then need to stuff our calculations back into the Structure or table so we can regurgitate later.  We stuff date in to the following fields trdExitPrice, trdExitDate, trdProfit and trdCumuProfit in the table.

Formatted Print: mEntryPrice:4:5

Notice in the code how I follow the print out of variables with :8:0 or :4:5?  I am telling TradeStation to use either 0 or 5 decimal places.  The date doesn’t need decimals but prices do.  So I format that so that they will line up really pretty like.

Now that I take care of liquidating an existing position all I need to do is increment the number of trades and stuff the new trade information into the Structure.

		numTrades +=1;
mEntryPrice = maxList(o,stb1);
tradeStruct[numTrades,trdID] = 1;
tradeStruct[numTrades,trdPOS] = 1;
tradeStruct[numTrades,trdEntryPrice] = mEntryPrice;
tradeStruct[numTrades,trdEntryDate] = date;
mPos = 1;
print(d+19000000:8:0," longEntry ",mEntryPrice:4:5);

The same goes for the short entry and long exit side of things.  Just review the code.  I print out the trades as we go along through the history of crude.  All the while stuffing the table.

If LastBarOnChart -> Regurgitate

On the last bar of the chart we know exactly how many trades have been executed because we were keeping track of them in the Shadow System.  So it is very easy to loop from 0 to numTrades.

if lastBarOnChart then
begin
print("Trade History");
for arrIndx = 1 to numTrades
begin
value20 = tradeStruct[arrIndx,trdEntryDate];
value21 = tradeStruct[arrIndx,trdEntryPrice];
value22 = tradeStruct[arrIndx,trdExitDate];
value23 = tradeStruct[arrIndx,trdExitPrice];
value24 = tradeStruct[arrIndx,trdID];
value25 = tradeStruct[arrIndx,trdProfit];
value26 = tradeStruct[arrIndx,trdCumuProfit];

print("---------------------------------------------------------------------");
if value24 = 1 then
begin
string1 = buyStr;
string2 = sellStr;
end;
if value24 = 2 then
begin
string1 = shortStr;
string2 = coverStr;
end;
print(value20+19000000:8:0,string1,value21:4:5," ",value22+19000000:8:0,string2,
value23:4:5," ",value25:6:0," ",value26:7:0);
end;
end;

Add 19000000 to Dates for easy Translation

Since all trade information is stored in the Structure or Table then pulling the information out using our Field Descriptors is very easy.  Notice I used EL built-in valueXX to store table information.  I did this to make the print statements a lot shorter.  I could have just used tradeStruct[arrIndx, trdEntry] or whatever was needed to provide the right information, but the lines would be hard to read.  To translate EL date to a normal looking data just add 19,000,000 [without commas].

If you format your PrintLog to a monospaced font your out put should look like this.


PrintLog OutPut

Why Would We Want to Save Trade Information?

The answer to this question will be answered in Part 2.  Email me with any other questions…..

Why Do I Need to Test with Intraday Data

Why Can’t I Just Test with Daily Bars and Use Look-Inside Bar?

Good question.  You can’t because it doesn’t work accurately all of the time.   I just default to using 5 minute or less bars whenever I need to.  A large portion of short term, including day trade, systems need to know the intra day market movements to know which orders were filled accurately.  It would be great if you could just flip a switch and convert a daily bar system to an intraday system and Look Inside Bar(LIB) is theoretically that switch.  Here I will prove that switch doesn’t always work.

Daily Bar System

  • Buy next bar at open of the day plus 20% of the 5 day average range
  • SellShort next at open of the day minus 20% of the 5 day average range
  • If long take a profit at one 5 day average range above entryPrice
  • If short take a profit at one 5 day average range below entryPrice
  • If long get out at a loss at 1/2 a 5 day average range below entryPrice
  • If short get out at a loss at 1/2 a 5 day average range above entry price
  • Allow only 1 long and 1 short entry per day
  • Get out at the end of the day

Simple Code for the System

value1 = .2 * average(Range,5);
value2 = value1 * 5;

Buy next bar at open of next bar + value1 stop;
sellShort next bar at open of next bar - value1 stop;

setProfitTarget(value2*bigPointValue);
setStopLoss(value2/2*bigPointValue);
setExitOnClose;
Simplified Daily Bar DayTrade System using ES.D Daily
Daily Bar Using 5 min Look Inside Bar

Looks great with just the one hiccup:  Bot @ 3846.75 and the Shorted @ 3834.75 and then took nearly 30 handles of profit.

Now let’s see what really happened.

What Really Happened – Bot – Shorted – Stopped Out

Intraday Code to Control Entry Time and Number of Longs and Shorts

Not an accurate representation so let’s take this really simple system and apply it to intraday data.  Approaching this from a logical perspective with limited knowledge about TradeStation you might come up with this seemingly valid solution.  Working on the long side first.

//First Attempt


if d <> d[1] then value1 = .2 * average(Range of data2,5);
value2 = value1 * 5;
if t > sess1startTime then buy next bar at opend(0) + value1 stop;
setProfitTarget(value2*bigPointValue);
setStopLoss(value2/2*bigPointValue);
setExitOnClose;
First Simple Attempt

This looks very similar to the daily bar system.  I cheated a little by using

if d <> d[1] then value1 = .2 * average(Range of data2,5);

Here I am only calculating the average once a day instead of on each 5 minute bar.  Makes things quicker.  Also I used

if t > sess1StartTime then buy next bar at openD(0) + value1 stop;

I did that because if you did this:

buy next bar at open of next bar + value1 stop;

You would get this:

Cannot Sneak a Peek with Data2

That should do it for the long side, right?

Didn’t work quite right!

So now we have to monitor when we can place a trade and monitor the number of long and short entries.

How does this look!

Correct Execution!

So here is the code.  You will notice the added complexity.  The important things to know is how to control when an entry is allowed and how to count the number of long and short entries.  I use the built-in keyword/function totalTrades to keep track of entries/exits and marketPosition to keep track of the type of entry.

Take a look at the code and you can see how the daily bar system is somewhat embedded in the code.  But remember you have to take into account that you are stepping through every 5 minute bar and things change from one bar to the next.

vars: buysToday(0),shortsToday(0),curTotTrades(0),mp(0),tradeZoneTime(False);


if d <> d[1] then
begin
curTotTrades = totalTrades;
value1 = .2 * average(Range of data2,5);
value2 = value1 * 5;
buysToday = 0;
shortsToday = 0;
tradeZoneTime = False;
end;

mp = marketPosition;

if totalTrades > curTotTrades then
begin
if mp <> mp[1] then
begin
if mp[1] = 1 then buysToday = buysToday + 1;
if mp[1] = -1 then shortsToday = shortsToday + 1;
end;
if mp[1] = -1 then print(d," ",t," ",mp," ",mp[1]," ",shortsToday);
curTotTrades = totalTrades;
end;
if t > sess1StartTime and t < sess1EndTime then tradeZoneTime = True;

if tradeZoneTime and buysToday = 0 and mp <> 1 then
buy next bar at opend(0) + value1 stop;

if tradeZoneTime and shortsToday = 0 and mp <> -1 then
sellShort next bar at opend(0) - value1 stop;

setProfitTarget(value2*bigPointValue);
setStopLoss(value2/2*bigPointValue);
setExitOnClose;
Proper Code to Replicate the Daily Bar System with Accuracy

Here’s a few trade examples to prove our code works.

Looks Right!

Okay the code worked but did the system?

Uh? NO!

Conclusion

If you need to know what occurred first – a high or a low in a move then you must use intraday data.  If you want to have multiple entries then of course your only alternative is intraday data.   This little bit of code can get you started converting your daily bar systems to intraday data and can be a framework to develop your own day trading/or swing systems.

Can I Prototype A Short Term System with Daily Data?

You can of course use Daily Bars for fast system prototyping.  When the daily bar system was tested with LIB turned on, it came close to the same results as the more accurately programmed intraday system.  So you can prototype to determine if a system has a chance.  Our core concept buyt a break out, short a break out, take profits and losses and have no overnight exposure sounds good theoretically.  And if you only allow 2 entries in opposite directions on a daily bar you can determine if there is something there.

A Dr. Jekyll and Mr. Hyde Scenario

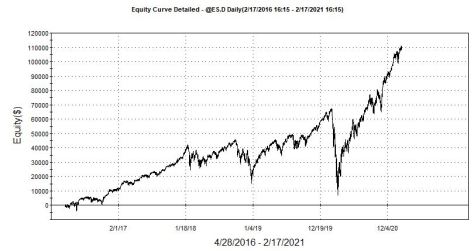
While playing around with this I did some prototyping of a daily bar system and created this equity curve.  I mistakenly did not allow any losses – only took profits and re-entered long.

Wow! Awesome! Holy Grail Uncovered. Venalicius Cave!

Venalicius Cave!  Don’t take a loser you and will reap the benefits.  The chart says so – so its got to be true – I know right?

The same chart from a different perspective.

You Start and End at the Same Place. But What A Ride. Yikes!

Moral of the Story – always look at your detailed Equity Curve.  This curve is very close to a simple buy and hold strategy.   Maybe a little better.

Daily Bar Ratcheting Stop and Conditional Optimization

Happy New Year!  My First Post of 2021!

In this post I simply wanted to convert the intraday ratcheting stop mechanism that I previously posted into a daily bar mechanism.  Well that got me thinking of how many different values could be used as the amount to ratchet.  I came up with three:

I have had requests for the EasyLanguage in an ELD – so here it is – just click on the link and unZip.

RATCHETINGSTOPWSWITCH

Ratcheting Schemes

  • ATR of N days
  • Fixed $ Amount
  • Percentage of Standard Deviation of 20 Days

So this was going to be a great start to a post, because I was going to incorporate one of my favorite programming constructs : Switch-Case.  After doing the program I thought wouldn’t it be really cool to be able to optimize over each scheme the ratchet and trail multiplier as well as the values that might go into each scheme.

In scheme one I wanted to optimize the N days for the ATR calculation.  In scheme two I wanted to optimize the $ amount and the scheme three the percentage of a 20 day standard deviation.  I could do a stepwise optimization and run three independent optimizations – one for each scheme.  Why not just do one global optimization you might ask?  You could but it would be a waste of computer time and then you would have to sift through the results.  Huh?  Why?  Here is a typical optimization loop:

Scheme Ratchet Mult Trigger Mult Parameter 1
1 : ATR 1 1 ATR (2)
2 : $ Amt 1 1 ATR (2)
3 : % of Dev. Amt 1 1 ATR (2)
1 : ATR 2 1 ATR (2)
2 : $ Amt 2 1 ATR (2)

Notice when we switch schemes the Parameter 1 doesn’t make sense.  When we switch to $ Amt we want to use a $ Value as Parameter 1 and not ATR.  So we could do a bunch of optimizations across non sensical values, but that wouldn’t really make a lot of sense.  Why not do a conditional optimization?  In other words, optimize only across a certain parameter range based on which scheme is currently being used.  I knew there wasn’t an overlay available to use using standard EasyLanguage but I thought maybe OOP,  and there is an optimization API that is quite powerful.  The only problem is that it was very complicated and I don’t know if I could get it to work exactly the way I wanted.

EasyLanguage is almost a full blown programming language.  So should I not be able to distill this conditional optimization down to something that I could do with such a powerful programming language?  And the answer is yes and its not that complicated.  Well at least for me it wasn’t but for beginners probably.  But to become a successful programmer you have to step outside your comfort zones, so I am going to not only explain the Switch/Case construct (I have done this in earlier posts)  but incorporate some array stuff.

When performing conditional optimization there are really just a few things you have to predefine:

  1. Scheme Based Optimization Parameters
  2. Exact Same Number of Iterations for each Scheme [starting point and increment value]
  3. Complete Search Space
  4. Total Number of Iterations
  5. Staying inside the bounds of your Search Space

Here are the optimization range per scheme:

  • Scheme #1 – optimize number of days in ATR calculation – starting at 10 days and incrementing by 2 days
  • Scheme #2 – optimize $ amounts – starting at $250 and incrementing by $100
  • Scheme #3 – optimize percent of 20 Bar standard deviation – starting at 0,25 and incrementing by 0.25

I also wanted to optimize the ratchet and target multiplier.  Here is the base code for the daily bar ratcheting system with three different schemes.  Entries are based on penetration of 20 bar highest/lowest close.

inputs: 
ratchetMult(2),trailMult(2),
volBase(True),volCalcLen(20),
dollarBase(False),dollarAmt(250),
devBase(False),devAmt(0.25);


vars:longMult(0),shortMult(0);
vars:ratchetAmt(0),trailAmt(0);
vars:stb(0),sts(0),mp(0);
vars:lep(0),sep(0);


if volBase then
begin
ratchetAmt = avgTrueRange(volCalcLen) * ratchetMult;
trailAmt = avgTrueRange(volCalcLen) * trailMult;
end;
if dollarBase then
begin
ratchetAmt =dollarAmt/bigPointValue * ratchetMult;
trailAmt = dollarAmt/bigPointValue * trailMult;
end;
if devBase then
begin
ratchetAmt = stddev(c,20) * devAmt * ratchetMult;
trailAmt = stddev(c,20) * devAmt * trailMult;
end;


if c crosses over highest(c[1],20) then buy next bar at open;
if c crosses under lowest(c[1],20) then sellshort next bar at open;

mp = marketPosition;
if mp <> 0 and mp[1] <> mp then
begin
longMult = 0;
shortMult = 0;
end;


If mp = 1 then lep = entryPrice;
If mp =-1 then sep = entryPrice;


// Okay initially you want a X point stop and then pull the stop up
// or down once price exceeds a multiple of Y points
// longMult keeps track of the number of Y point multiples of profit
// always key off of lep(LONG ENTRY POINT)
// notice how I used + 1 to determine profit
// and - 1 to determine stop level

If mp = 1 then
Begin
If h >= lep + (longMult + 1) * ratchetAmt then longMult = longMult + 1;
Sell("LongTrail") next bar at (lep + (longMult - 1) * trailAmt) stop;
end;

If mp = -1 then
Begin
If l <= sep - (shortMult + 1) * ratchetAmt then shortMult = shortMult + 1;
buyToCover("ShortTrail") next bar (sep - (shortMult - 1) * trailAmt) stop;
end;
Daily Bar Ratchet System

This code is fairly simple.  The intriguing inputs are:

  • volBase [True of False] and  volCalcLen [numeric Value]
  • dollarBase [True of False] and  dollarAmt [numeric Value]
  • devBase [True of False] and devAmt [numeric Value]

If volBase is true then you use the parameters that go along with that scheme.  The same goes for the other schemes.  So when you run this you would turn one scheme on at a time and set the parameters accordingly.  if I wanted to use dollarBase(True) then I would set the dollarAmt to a $ value.  The ratcheting mechanism is the same as it was in the prior post so I refer you back to that one for further explanation.

So this was a pretty straightforward strategy.  Let us plan out our optimization search space based on the different ranges for each scheme.  Since each scheme uses a different calculation we can’t simply optimize across all of the different ranges – one is days, and the other two are dollars and percentages.

Enumerate

We know how to make TradeStation loop based on the range of a value.  If you want to optimize from $250 to $1000 in steps of $250, you know this involves [$1000 – $250] / $250 + 1 or 3 + 1 or 4 interations.   Four loops will cover this entire search space.  Let’s examine the search space for each scheme:

  • ATR Scheme: start at 10 bars and end at 40 by steps of 2 or [40-10]/2 + 1 = 16
  • $ Amount Scheme: start at $250 and since we have to have 16 iterations [remember # of iterations have to be the same for each scheme] what can we do to use this information?  Well if we start $250 and step by $100 we cover the search space $250, $350, $450, $550…$1,750.  $250 + 15 x 250.  15 because $250 is iteration 1.
  • Percentage StdDev Scheme:  start at 0.25 and end at 0.25 + 15 x 0.25  = 4

So we enumerate 16 iterations to a different value.  The easiest way to do this is to create a map.  I know this seems to be getting hairy but it really isn’t.  The map will be defined as an array with 16 elements.  The array will be filled with the search space based on which scheme is currently being tested.  Take a look at this code where I show how to define an array of 16 elements and introduce my Switch/Case construct.

array: optVals[16](0);

switch(switchMode)
begin
case 1:
startPoint = 10; // vol based
increment = 2;
case 2:
startPoint = 250/bigPointValue; // $ based
increment = 100/bigPointValue;
case 3:
startPoint = 0.25; //standard dev
increment = 0.25*minMove/priceScale;
default:
startPoint = 1;
increment = 1;
end;

vars: cnt(0),loopCnt(0);
once
begin
for cnt = 1 to 16
begin
optVals[cnt] = startPoint + (cnt-1) * increment;
end;
end
Set Up Complete Search Space for all Three Schemes

This code creates a 16 element array, optVals, and assigns 0 to each element.  SwitchMode goes from 1 to 3.

  • if switchMode is 1: ATR scheme [case: 1] the startPoint is set to 10 and increment is set to 2
  • if switchMode is 2: $ Amt scheme [case: 2] the startPoint is set to $250 and increment is set to $100
  • if switchMode is 3: Percentage of StdDev [case: 3] the startPoint is set to 0.25 and the increment is set to 0.25

Once these two values are set the following 15 values can be spawned by the these two.  A for loop is great for populating our search space.  Notice I wrap this code with ONCE – remember ONCE  is only executed at the very beginning of each iteration or run.

once
begin
   for cnt = 1 to 16
   begin
     optVals[cnt] = startPoint + (cnt-1) * increment;
   end;
end

Based on startPoint and increment the entire search space is filled out.  Now all you have to do is extract this information stored in the array based on the iteration number.

Switch(switchMode) 
Begin
Case 1:
ratchetAmt = avgTrueRange(optVals[optLoops]) * ratchetMult;
trailAmt = avgTrueRange(optVals[optLoops]) * trailMult;
Case 2:
ratchetAmt =optVals[optLoops] * ratchetMult;
trailAmt = optVals[optLoops] * trailMult;
Case 3:
ratchetAmt =stddev(c,20) * optVals[optLoops] * ratchetMult;
trailAmt = stddev(c,20) * optVals[optLoops] * trailMult;
Default:
ratchetAmt = avgTrueRange(optVals[optLoops]) * ratchetMult;
trailAmt = avgTrueRange(optVals[optLoops]) * trailMult;
end;


if c crosses over highest(c[1],20) then buy next bar at open;
if c crosses under lowest(c[1],20) then sellshort next bar at open;

mp = marketPosition;
if mp <> 0 and mp[1] <> mp then
begin
longMult = 0;
shortMult = 0;
end;


If mp = 1 then lep = entryPrice;
If mp =-1 then sep = entryPrice;


// Okay initially you want a X point stop and then pull the stop up
// or down once price exceeds a multiple of Y points
// longMult keeps track of the number of Y point multiples of profit
// always key off of lep(LONG ENTRY POINT)
// notice how I used + 1 to determine profit
// and - 1 to determine stop level

If mp = 1 then
Begin
If h >= lep + (longMult + 1) * ratchetAmt then longMult = longMult + 1;
Sell("LongTrail") next bar at (lep + (longMult - 1) * trailAmt) stop;
end;

If mp = -1 then
Begin
If l <= sep - (shortMult + 1) * ratchetAmt then shortMult = shortMult + 1;
buyToCover("ShortTrail") next bar (sep - (shortMult - 1) * trailAmt) stop;
end;
Extract Search Space Values and Rest of Code

Switch(switchMode)
Begin
Case 1:
  ratchetAmt = avgTrueRange(optVals[optLoops])ratchetMult;
  trailAmt = avgTrueRange(optVals[optLoops]) trailMult;
Case 2:
  ratchetAmt =optVals[optLoops] * ratchetMult;
  trailAmt = optVals[optLoops] * trailMult;
Case 3:
  ratchetAmt =stddev(c,20)optVals[optLoops]
ratchetMult;
  trailAmt = stddev(c,20) * optVals[optLoops] * trailMult;

Notice how the optVals are indexed by optLoops.  So the only variable that is optimized is the optLoops and it spans 1 through 16.  This is the power of enumerations – each number represents a different thing and this is how you can control which variables are optimized in terms of another optimized variable.   Here is my optimization specifications:

Opimization space

And here are the results:

Optimization Results

The best combination was scheme 1 [N-day ATR Calculation] using a 2 Mult Ratchet and 1 Mult Trail Trigger.  The best N-day was optVals[2] for this scheme.  What in the world is this value?  Well you will need to back engineer a little bit here.  The starting point for this scheme was 10 and the increment was 2 so if optVals[1] =10 then optVals[2] = 12 or ATR(12).    You can also print out a map of the search spaces.

vars: cnt(0),loopCnt(0);
once
begin
loopCnt = loopCnt + 1;
// print(switchMode," : ",d," ",startPoint);
// print(" ",loopCnt:2:0," --------------------");
for cnt = 1 to 16
begin
optVals[cnt] = startPoint + (cnt-1) * increment;
// print(cnt," ",optVals[cnt]," ",cnt-1);
end;
end;
  Scheme 1
--------------------
1.00 10.00 0.00 10 days
2.00 12.00 1.00
3.00 14.00 2.00
4.00 16.00 3.00
5.00 18.00 4.00
6.00 20.00 5.00
7.00 22.00 6.00
8.00 24.00 7.00
9.00 26.00 8.00
10.00 28.00 9.00
11.00 30.00 10.00
12.00 32.00 11.00
13.00 34.00 12.00
14.00 36.00 13.00
15.00 38.00 14.00
16.00 40.00 15.00

Scheme2
--------------------
1.00 5.00 0.00 $ 250
2.00 7.00 1.00 $ 350
3.00 9.00 2.00 $ 400
4.00 11.00 3.00 $ ---
5.00 13.00 4.00
6.00 15.00 5.00
7.00 17.00 6.00
8.00 19.00 7.00
9.00 21.00 8.00
10.00 23.00 9.00
11.00 25.00 10.00
12.00 27.00 11.00
13.00 29.00 12.00
14.00 31.00 13.00
15.00 33.00 14.00
16.00 35.00 15.00 $1750

Scheme 3
--------------------
1.00 0.25 0.00 25 % stdDev
2.00 0.50 1.00
3.00 0.75 2.00
4.00 1.00 3.00
5.00 1.25 4.00
6.00 1.50 5.00
7.00 1.75 6.00
8.00 2.00 7.00
9.00 2.25 8.00
10.00 2.50 9.00
11.00 2.75 10.00
12.00 3.00 11.00
13.00 3.25 12.00
14.00 3.50 13.00
15.00 3.75 14.00
16.00 4.00 15.00

This was a elaborate post so please email me with questions.  I wanted to demonstrate that we can accomplish very sophisticated things with just the pure and raw EasyLanguage which is a programming language itself.

A Simple Break Out Algorithm Demonstrating Time Optimization

What is Better:  30, 60, or 120 Minute Break-Out on ES.D

Here is a simple tutorial you can use as a foundation to build a potentially profitable day trading system.  Here we wait N minutes after the open and then buy the high of the day or short the low of the day and apply a protective stop and profit objective.  The time increment can be optimized to see what time frame is best to use.  You can also optimize the stop loss and profit objective – this system gets out at the end of the day.  This system can be applied to any .D data stream in TradeStation or Multicharts.

Logic Description

  1. get open time
  2. get close time
  3. get N time increment
    1. 15 – first 15 minute of day
    2. 30 – first 30 minute of day
    3. 60 – first hour of day
  4. get High and Low of day
  5. place stop orders at high and low of day – no entries late in day
  6. calculate buy and short entries – only allow one each*
  7. apply stop loss
  8. apply profit objective
  9. get out at end of day if not exits have occurred

Optimization Results [From 15 to 120 by 5 minutes] on @ES.D 5 Minute Chart – Over Last Two Years

Optimization of Time: Look How the # Trades Decrease as the Time Increment Increases

Simple Orbo EasyLanguage

I threw this together rather quickly in a response to a reader’s question.  Let me know if you see a bug or two.  Remember once you gather your stops you must allow the order to be issued on every subsequent bar of the trading day.  The trading day is defined to be the time between timeIncrement and endTradeMinB4Close.  Notice how I used the EL function calcTime to calculate time using either a +positive or -negative input.  I want to sample the high/low of the day at timeIncrement and want to trade up until endTradeMinB4Close time.  I use the HighD and LowD functions to extract the high and low of the day up to that point.  Since I am using a tight stop relative to today’s volatility you will see more than 1 buy or 1 short occurring.  This happens when entry/exit occurs on the same bar and MP is not updated accordingly.  Somewhere  hidden in this tome of a blog you will see a solution for this.  If you don’t want to search I will repost it tomorrow.


//Optimizing Time to determine a simple break out
//Only works on .D data streams
Inputs: timeIncrement(15),endTradeMinB4Close(-15),stopLoss$(500),profTarg$(1000);

vars: firstBarTime(0),lastBarTime(0),buyStop(0),shortStop(0),
calcStopTime(0),quitTradeTime(0),buysToday(0),shortsToday(0),mp(0);

firstBarTime = sessionStartTime(0,1);
lastBarTime = sessionEndTime(0,1);

calcStopTime = calcTime(firstBarTime,timeIncrement);
quitTradeTime = calcTime(lastBarTime,endTradeMinB4Close);


If time = calcStopTime then
begin
buyStop = HighD(0);
shortStop = LowD(0);
buysToday = 0;
shortsToday = 0;
End;

if time >= calcStopTime and time < quitTradeTime then
begin
if buysToday = 0 then Buy next bar at buyStop stop;
if shortsToday = 0 then Sell short next bar at shortStop stop;
end;

mp = marketPosition;

If mp = 1 then buysToday = 1;
If mp = -1 then shortsToday = 1;

SetStopLoss(stopLoss$);
setProfitTarget(profTarg$);
setExitOnClose;
Orbo EasyLanguage Code


The Complete Turtle EasyLanguage [Well About as Close as You Can Get]

The Complete Turtle EasyLanguage – Almost!

I have seen a plethora of posts on the Turtle trading strategies where the rules and code are provided.  The codes range from a mere Donchian breakout to a fairly close representation.  Without dynamic portfolio feedback its rather impossible to program the portfolio constraints as explained by Curtis Faith in his well received “Way Of The Turtle.”  But the other components can be programmed rather closely to Curtis’ descriptions.   I wanted to provide this code in a concise manner to illustrate some of EasyLanguage’s esoteric constructs and some neat shortcuts.  First of all let’s take a look at how the system has performed on Crude for the past 15 years.

Turtle Performance on Crude past 15 years

If a market trends, the Turtle will catch it.  Look how the market rallied in 2007 and immediately snapped back in 2008, and look at how the Turtle caught the moves – impressive.  But see how the system stops working in congestion.  It did take a small portion of the 2014 move down and has done a great job of catching the pandemic collapse and bounce.  In my last post, I programmed the LTL (Last Trader Loser) function to determine the success/failure of the Turtle System 1 entry.  I modified it slightly for this post and used it in concert with Turtle System 2 Entry and the 1/2N AddOn pyramid trade to get as close as possible to the core of the Turtle Entry/Exit logic.

Can Your Program This – sure you CAN!

Can You Program This?

I will provide the ELD so you can review at your leisure, but here are the important pieces of the code that you might not be able to derive without a lot of programming experience.

If mp[1] <> mp and mp <> 0 then 
begin
if mp = 1 then
begin
origEntry = entryPrice;
origEntryName = "Sys1Long";
If ltl = False and h >= lep1[1] then origEntryName = "Sys2Long";
end;
if mp =-1 then
begin
origEntry = entryPrice;
origEntryName = "Sys1Short";
If ltl = False and l <= sep1[1] then origEntryName = "Sys2Short";
end;
end;
Keeping Track Of Last Entry Signal Price and Name

This code determines if the current market position is not flat and is different than the prior bar’s market position.  If this is the case then a new trade has been executed.  This information is needed so that you know which exit to apply without having to forcibly tie them together using EasyLanguage’s from Entry keywords.  Here I just need to know the name of the entry.  The entryPrice is the entryPrice.  Here I know if the LTL is false, and the entryPrice is equal to or greater/less  than (based on current market position) than System 2 entry levels, then I know that System 2 got us into the trade.

If mp = 1 and origEntryName = "Sys1Long" then Sell currentShares shares next bar at lxp stop;
If mp =-1 and origEntryName = "Sys1Short" then buyToCover currentShares shares next bar at sxp stop;

//55 bar component - no contingency here
If mp = 0 and ltl = False then buy("55BBO") next bar at lep1 stop;
If mp = 1 and origEntryName = "Sys2Long" then sell("55BBO-Lx") currentShares shares next bar at lxp1 stop;

If mp = 0 and ltl = False then sellShort("55SBO") next bar at sep1 stop;
If mp =-1 and origEntryName = "Sys2Short" then buyToCover("55SBO-Sx") currentShares shares next bar at sxp1 stop;
Entries and Exits

The key to this logic is the keywords currentShares shares.  This code tells TradeStation to liquidate all the current shares or contracts at the stop levels.  You could use currentContracts contracts if you are more comfortable with futures vernacular.

AddOn Pyramiding Signal Logic

Before you can pyramid you must turn it on in the Strategy Properties.

Turn Pyramiding ON
If mp = 1 and currentShares < 4 then buy("AddonBuy") next bar at entryPrice + (currentShares * .5*NValue) stop;
If mp =-1 and currentShares < 4 then sellShort("AddonShort") next bar at entryPrice - (currentShares * .5*NValue) stop;

This logic adds positions on from the original entryPrice in increments of 1/2N.  The description for this logic is a little fuzzy.  Is the N value the ATR reading when the first contract was put on or is it dynamically recalculated?  I erred on the side of caution and used the N when the first contract was put on.  So to calculate the AddOn long entries you simply take the original entryPrice and add the currentShares * .5N.  So if currentShares is 1, then the next pyramid level would be entryPrice + 1* .5N.  If currentShares is 2 ,then entryPrice + 2* .5N and so on an so forth.  The 2N stop trails from the latest entryPrice.  So if you put on 4 contracts (specified in Curtis’ book), then the trailing exit would be 2N from where you added the 4th contract.  Here is the code for that.

Liquidate All Contracts at Last Entry –  2N

vars: lastEntryPrice(0);
If cs <= 1 then lastEntryPrice = entryPrice;
If cs > 1 and cs > cs[1] and mp = 1 then lastEntryPrice = entryPrice + ((currentShares-1) * .5*NValue);
If cs > 1 and cs > cs[1] and mp =-1 then lastEntryPrice = entryPrice - ((currentShares-1) * .5*NValue);

//If mp = -1 then print(d," ",lastEntryPrice," ",NValue);

If mp = 1 then sell("2NLongLoss") currentShares shares next bar at lastEntryPrice-2*NValue stop;
If mp =-1 then buyToCover("2NShrtLoss") currentShares shares next bar at lastEntryPrice+2*NValue Stop;
Calculate Last EntryPrice and Go From There

I introduce a new variable here: cs.  CS stands for currentShares and I keep track of it from bar to bar.  If currentShares or cs is less than or equal to1 I know that the last entryPrice was the original entryPrice.  Things get a little more complicated when you start adding positions – initially I couldn’t remember if EasyLanguage’s entryPrice contained the last entryPrice or the original – turns out it is the original – good to know.  So, if currentShares is greater than one and the current bar’s currentShares is greater than the prior bar’s currentShares, then I know I added on another contract and therefore must update lastEntryPrice.  LastEntryPrice is calculated by taking the original entryPrice and adding (currentShares-1) * .5N.  Now this is the theoretical entryPrice, because I don’t take into consideration slippage on entry.  You could make this adjustment.  So, once I know the lastEntryPrice I can determine 2N from that price.

Getting Out At 2N Trailing Stop

If mp = 1 then sell("2NLongLoss") currentShares shares next bar at lastEntryPrice-2*NValue stop;
If mp =-1 then buyToCover("2NShrtLoss") currentShares shares next bar at lastEntryPrice+2*NValue Stop;
Get Out At LastEntryPrice +/-2N

That’s all of the nifty code.  Below is the function and ELD for my implementation of the Turtle dual entry system.   You will see some rather sophisticated code when it comes to System 1 Entry and this is because of these scenarios:

  • What if you are theoretically short and are theoretically stopped out for a true loser and you can enter on the same bar into a long trade.
  • What if you are theoretically short and the reversal point would result in a losing trade.  You wouldn’t  record the loser in time to enter the long position at the reversal point.
  • What if you are really short and the reversal point would results in a true loser, then you would want to allow the reversal at that point

There are probably some other scenarios, but I think I covered all bases.  Just let me know if that’s not the case.  What I did to validate the entries was I programmed a 20/10 day breakout/failure with a 2N stop and then went through the list and deleted the trades that followed a non 2N loss (10 bar exit for a loss or a win.)  Then I made sure those trades were not in the output of the complete system.  There was quite a bit of trial and error.  If you see a mistake, like I said, just let me know.

Remember I published the results of different permutations of this strategy incorporating dynamic portfolio feedback at my other site www.trendfollowingsystems.com.  These results reflect the a fairly close portfolio that Curtis suggests in his book.

TURTLELTLFUNCTEST


Turn of the Month Trading Strategy [Stock Indices Only]

The System

This system has been around for several years.  Its based on the belief that fund managers start pouring money into the market near the end of the month and this creates momentum that lasts for just a few days.  The original system states to enter the market on the close of the last bar of the day if the its above a certain moving average value.  In the Jaekle and Tomasini book, the authors describe such a trading system.  Its quite simple, enter on the close of the month if its greater than X-Day moving average and exit either 4 days later or if during the trade the closing price drops below the X-Day moving average.

EasyLanguage or Multi-Charts Version

Determining the end of the month should be quite easy -right?  Well if you want to use EasyLanguage on TradeStation and I think on Multi-Charts you can’t sneak a peek at the next bar’s open to determine if the current bar is the last bar of the month.  You can try, but you will receive an error message that you can’t mix this bar on close with next bar.  In other words you can’t take action on today’s close if tomorrow’s bar is the first day of the month.  This is designed, I think, to prevent from future leak or cheating.  In TradeStation the shift from backtesting to trading is designed to be a no brainer, but this does provide some obstacles when you only want to do a backtest.

LDOM function – last day of month for past 15 years or so

So I had to create a LastDayOfMonth function.  At first I thought if the day of the month is the 31st then it is definitely the last bar of the month.  And this is the case no matter what.  And if its the 30th then its the last day of the month too if the month is April, June, Sept, and November.  But what happens if the last day of the month falls on a weekend.  Then if its the 28th and its a Friday and the month is blah, blah, blah.  What about February?  To save time here is the code:

Inputs: movAvgPeriods(50);
vars: endOfMonth(false),theDayOfWeek(0),theMonth(0),theDayOfMonth(0),isLeapYear(False);

endOfMonth = false;
theDayOfWeek = dayOfWeek(date);
theMonth = month(date);
theDayOfMonth = dayOfMonth(date);
isLeapYear = mod(year(d),4) = 0;

// 29th of the month and a Friday
if theDayOfMonth = 29 and theDayOfWeek = 5 then
endOfMonth = True;
// 30th of the month and a Friday
if theDayOfMonth = 30 and theDayOfWeek = 5 then
endOfMonth = True;
// 31st of the month
if theDayOfMonth = 31 then
endOfMonth = True;
// 30th of the month and April, June, Sept, or Nov
if theDayOfMonth = 30 and (theMonth=4 or theMonth=6 or theMonth=9 or theMonth=11) then
endOfMonth = True;
// 28th of the month and February and not leap year
if theDayOfMonth = 28 and theMonth = 2 and not(isLeapYear) then
endOfMonth = True;
// 29th of the month and February and a leap year or 28th, 27th and a Friday
if theMonth = 2 and isLeapYear then
Begin
If theDayOfMonth = 29 or ((theDayOfMonth = 28 or theDayOfMonth = 27) and theDayOfWeek = 5) then
endOfMonth = True;
end;
// 28th of the month and Friday and April, June, Sept, or Nov
if theDayOfMonth = 28 and (theMonth = 4 or theMonth = 6 or
theMonth = 9 or theMonth =11) and theDayOfWeek = 5 then
endOfMonth = True;
// 27th, 28th of Feb and Friday
if theMonth = 2 and theDayOfWeek = 5 and theDayOfMonth = 27 then
endOfMonth = True;
// 26th of Feb and Friday and not LeapYear
if theMonth = 2 and theDayOfWeek = 5 and theDayOfMonth = 26 and not(isLeapYear) then
endOfMonth = True;
// Memorial day adjustment
If theMonth = 5 and theDayOfWeek = 5 and theDayOfMonth = 28 then
endOfMonth = True;
//Easter 2013 adjustment
If theMonth = 3 and year(d) = 113 and theDayOfMonth = 28 then
endOfMonth = True;
//Easter 2018 adjustment
If theMonth = 3 and year(d) = 118 and theDayOfMonth = 29 then
endOfMonth = True;

if endOfMonth and c > average(c,movAvgPeriods) then
Buy("BuyDay") this bar on close;

If C <average(c,movAvgPeriods) then
Sell("MovAvgExit") this bar on close;
If BarsSinceEntry=4 then
Sell("4days") this bar on close;
Last Day Of Month Function and Strategy

All the code is generic except for the hard code for days that are a consequence of Good Friday.

All this code because I couldn’t sneak a peek at the date of tomorrow.  Here are the results of trading the ES futures sans execution costs for the past 15 years.

Last Day Of Month Buy If C > 50 Day Mavg

What if it did the easy way and executed the open of the first bar of the month.

If c > average(c,50) and month(d) <> month(d of tomorrow) then 
buy next bar at open;

If barsSinceEntry >=3 then
sell next bar at open;

If marketPosition = 1 and c < average(c,50) then
sell next bar at open;
Buy First Day Of Month
First Day of Month If C > 50 Day Mavg

The results aren’t as good but it sure was easier to program.

TradingSimula-18 Version

Since you can use daily bars we can test this with my TradingSimula-18 Python platform.  And we will execute on the close of the month.  Here is the snippet of code that you have to concern yourself with.  Here I am using Sublime Text and utilizing their text collapsing tool to hide non-user code:

Small Snippet of TS-18 Code

This was easy to program in TS-18 because I do allow Future Leak – in other words I will let you sneak a peek at tomorrow’s values and make a decision today.  Now many people might say this is a huge boo-boo, but with great power comes great responsibility.  If you go in with eyes wide open, then you will only use the data to make things easier or even doable, but without cheating.  Because you are only going to cheat yourself.  Its in your best interest do follow the rules.  Here is the line that let’s you leak into the future.

If isNewMonth(myDate[curBar+1])

The curBar is today and curBar+1 is tomorrow.  So I am saying if tomorrow is the first day of the month then buy today’s close.  Here you are leaking into the future but not taking advantage of it.  We all know if today is the last day of the month, but try explaining that to a computer.  You saw the EasyLanguage code.  So things are made easier with future leak, but not taking advantage of .

Here is a quick video of running the TS-18 Module of 4 different markets.


A Quant’s ToolBox: Beautiful Soup, Python, Excel and EasyLanguage

Many Times It Takes Multiple Tools to Get the Job Done

Just like a mechanic, a Quant needs tools to accomplish many programming tasks.  In this post, I use a toolbox to construct an EasyLanguage function that will test a date and determine if it is considered a Holiday in the eyes of the NYSE.

Why a Holiday Function?

TradeStation will pump holiday data into a chart and then later go back and take it out of the database.  Many times the data will only be removed from the daily database, but still persist in the intraday database.  Many mechanical day traders don’t want to trade on a shortened holiday session or use the data for indicator/signal calculations.  Here is an example of a gold chart reflecting President’s Day data in the intra-day data and not in the daily.

Holiday Data Throws A Monkey Wrench Into the Works

This affects many stock index day traders.  Especially if automation is turned on.  At the end of this post I provide a link to my youTube channel for a complete tutorial on the use of these tools to accomplish this task.  It goes along with this post.

First Get The Data

I searched the web for a list of historical holiday dates and came across this:

Historic List of Holidays and Their Dates

You might be able to find this in a easier to use format, but this was perfect for this post.

Extract Data with Beautiful Soup

Here is where Python and the plethora of its libraries come in handy.  I used pip to install the requests and the bs4 libraries.  If this sounds like Latin to you drop me an email and I will shoot you some instructions on how to install these libraries.  If you have Python, then you have the download/install tool known as pip.

Here is the Python code.  Don’t worry it is quite short.

# Created:     24/02/2020
# Copyright: (c) George 2020
# Licence: <your licence>
#-------------------------------------------------------------------------------

import requests
from bs4 import BeautifulSoup

url = 'http://www.market-holidays.com/'
page = requests.get(url)
soup = BeautifulSoup(page.text,'html.parser')
print(soup.title.text)
all_tables = soup.findAll('table')
#print (all_tables)
print (len(all_tables))
#print (all_tables[0])
print("***")
a = list()
b = list()
c = list()
#print(all_tables[0].find_all('tr')[0].text)
for numTables in range(len(all_tables)-1):
for rows in all_tables[numTables].find_all('tr'):
a.append(rows.find_all('td')[0].text)
b.append(rows.find_all('td')[1].text)

for j in range(len(a)-1):
print(a[j],"-",b[j])
Using Beautiful Soup to Extract Table Data

As you can see this is very simple code.  First I set the variable url to the website where the holidays are located.  I Googled on how to do this – another cool thing about Python – tons of users.  I pulled the data from the website and stuffed it into the page object.  The page object has several attributes (properties) and one of them  is a text representation of the entire page.  I pass this text to the BeautifulSoup library and inform it to parse it with the html.parser.  In other words, prepare to extract certain values based on html tags.  All_tables contains all of the tables that were parsed from the text file using Soup.  Don’t worry how this works, as its not important, just use it as a tool.  In my younger days as a programmer I would have delved into how this works, but it wouldn’t be worth the time because I just need the data to carry out my objective; this is one of the reasons classically trained programmers never pick up the object concept.  Now that I have all the tables in a list I can loop through each row in each table.  It looked liker there were 9 rows and 2 columns in the different sections of the website, but I didn’t know for sure so I just let the library figure this out for me.  So I played around with the code and found out that the first two columns of the table contained the name of the holiday and the date of the holiday.  So, I simply stuffed the text values of these columns in two lists:  a and b.  Finally I print out the contents of the two lists, separated by a hyphen, into the Interpreter window.  At this point I could simply carry on with Python and create the EasyLanguage statements and fill in the data I need.  But I wanted to play around with Excel in case readers didn’t want to go the Python route.  I could have used a powerful editor such as NotePad++ to extract the data from the website in place of Python.  GREP could have done this.  GREP is an editor tool to find and replace expressions in a text file.

Use Excel to Create Actual EasyLanguage – Really!

I created a new spreadsheet.  I used Excel, but you could use any spreadsheet software.   I first created a prototype of the code I would need to encapsulate the data into array structures.  Here is what I want the code to look like:

Arrays: holidayName[300](""),holidayDate[300](0);

holidayName[1]="New Year's Day "; holidayDate[1]=19900101;
Code Prototype

This is just the first few lines of the function prototype.  But you can notice a repetitive pattern.  The array names stay the same – the only values that change are the array elements and the array indices.  Computers love repetitiveness.  I can use this information a build a spreadsheet – take a look.

Type EasyLanguage Into the Columns and Fill Down!

I haven’t copied the data that I got out of Python just yet.  That will be step 2.  Column A has the first array name holidayName (notice I put the left square [ bracket in the column as well).  Column B will contain the array index and this is a formula.  Column C contains ]=”.  Column D will contain the actual holiday name and Column E contains theThese columns will build the holidayName array.  Columns G throuh K will build the holidayDates array.    Notice column  H  equals column B.  So whatever we do to column B (Index) will be reflected in Column H (Index).  So we have basically put all the parts of the EasyLanguage into  Columns A thru K. 

Excel provides tools for manipulating strings and text.  I will use the Concat function to build my EasyLanguageBut before I can use Concat all the stuff I want to string together must be in a string or text format.  The only column in the first five that is not a string is Column B.  So the first thing I have to do is convert it to text.  First copy the column and paste special as values.  Then go to your Data Tab and select Text To Columns. 

Text To Columns

It will ask if fixed width or delimited – I don’t think it matters which you pick.  On step 3 select text.

Text To Columns – A Powerful Tool

The Text To Columns button will solve 90% of your formatting issues in Excel.    Once you do this you will notice the numbers will be left justified – this signifies a text format.  Now lets select another sheet in the workbook and past the holiday data.

Copy Holiday Data Into Another Spreadsheet

New Year's Day - January 1, 2021
Martin Luther King, Jr. Day - January 18, 2021
Washington's Birthday (Presidents' Day) - February 15, 2021
Good Friday - April 2, 2021
Memorial Day - May 31, 2021
Independence Day - July 5, 2021
Labor Day - September 6, 2021
Thanksgiving - November 25, 2021
Christmas - December 24, 2021
New Year's Day - January 1, 2020
Martin Luther King, Jr. Day - January 20, 2020
Washington's Birthday (Presidents' Day) - February 17, 2020
Good Friday - April 10, 2020
Memorial Day - May 25, 2020
Holiday Output


Data Is In Column A

Text To Columns to the rescue.  Here I will separate the data with the “-” as delimiter and tell Excel to import the second column in Date format as MDY.  

Text To Columns with “-” as the delimiter and MDY as Column B Format

Now once the data is split accordingly into two columns with the correct format – we need to convert the date column into a string.

Convert Date to a String

Now the last couple of steps are really easy.  Once you have converted the date to a string, copy Column A and past into Column D from the first spreadsheet.  Since this is text, you can simply copy and then paste.  Now go back to Sheet 2 and copy Column C and paste special [values] in Column J on Sheet 1.  All we need to do now is concatenate the strings in Columns A thru E for the EasyLanguage for the holidayName array.  Columns G thru K will be concatenated for the holidayDate array.  Take a look.

Concatenate all the strings to create the EasyLanguage

Now create a function in the EasyLanguage editor and name it IsHoliday and have it return a boolean value.  Then all you need to do is copy/paste Columns F and L and the data from the website will now be available for you use.   Here is a portion of the function code.  Notice I declare the holidayNameStr as a stringRef?  I did this so I could change the variable in the function and pass it back to the calling routine.

Inputs : testDate(numericSeries),holidayNameStr(stringRef);

Arrays: holidayName[300](""),holidayDate[300](0);

holidayNameStr = "";

holidayName[1]="New Year's Day "; holidayDate[1]=19900101;
holidayName[2]="Martin Luther King, Jr. Day "; holidayDate[2]=19900115;
holidayName[3]="Washington's Birthday (Presidents' Day) "; holidayDate[3]=19900219;
holidayName[4]="Good Friday "; holidayDate[4]=19900413;
holidayName[5]="Memorial Day "; holidayDate[5]=19900528;
holidayName[6]="Independence Day "; holidayDate[6]=19900704;
holidayName[7]="Labor Day "; holidayDate[7]=19900903;
holidayName[8]="Thanksgiving "; holidayDate[8]=19901122;
holidayName[9]="New Year's Day "; holidayDate[9]=19910101;
holidayName[10]="Martin Luther King, Jr. Day "; holidayDate[10]=19910121;
holidayName[11]="Washington's Birthday (Presidents' Day) "; holidayDate[11]=19910218;

// There are 287 holiays in the database.
// Here is the looping mechanism to compare the data that is passed
// to the database

vars: j(0);
IsHoliday = False;
For j=1 to 287
Begin
If testDate = holidayDate[j] - 19000000 then
Begin
holidayNameStr = holidayName[j] + " " + numToStr(holidayDate[j],0);
IsHoliday = True;
end;
end;
A Snippet Of The Function - Including Header and Looping Mechanism

This was a pretty long tutorial and might be difficult to follow along.  If you want to watch my video, then go to this link.

I created this post to demonstrate the need to have several tools at your disposal if you really want to become a Quant programmer.  How you use those tools is up to you.  Also you will be able to take bits and pieces out of this post and use in other ways to get the data you really need.  I could have skipped the entire Excel portion of the post and just did everything in Python.  But I know a lot of Quants that just love spreadsheets.  You have to continually hone your craft in this business.   And you can’t let one software application limit your creativity.  If you have a problem always be on the lookout for alternative platforms and/or languages to help you solve it.


Get My Latest Book-TrendFollowing Systems: A DIY Project – Batteries Included

Just wanted to let you know that my latest book has just been published.

Trend Following Systems: A DIY Project – Batteries Included: Can You Reboot and Fix Yesterday’s Algorithms to Work with Today’s Markets? 

Trend Following Systems: A DIY Project – Batteries Included

This book introduces my new Python back-tester, TradingSimula-18.  It is completely and I mean completely self contained.  All you need is the latest version of Python and you will be up and running trading systems in less than 5 minutes.  Fifteen years of data on 30 futures is included (data from Quandl).  I have included more than 20 scripts that you can test and build on.   This back-tester is different than the one I published in the Ultimate Algorithmic Trading System Toolbox.  It utilizes what I call the horizontal portfolio spanning paradigm.  Instead of sequentially testing different markets in a portfoio:

It process data in the following manner:

This form of testing allows for decisions to be made on a portfolio basis at the end of any historic bar.   Things like inputting portfolio performance into an allocation formula is super simple.  However, this paradigm opens up a lot of different “what-if” scenarios.

  1. What If I Limit 2 Markets Per Sector
  2. What If I Turn Off A Certain Sector
  3. What If I Liquidate The Largest OTE loser
  4. What If I Liquidate The Largest OTE winner
  5. What If I Only Trade The Ten Markets With The Highest ADX Values

All the data and market performance and portfolio performance is right at your fingertips.  Your testing is only limited by your creativity.

The best part is you get to learn raw Python without having to install complicated libraries like SciKit, Numpy or Pandas.  You don’t even need to install distributions of commercial products – like Anaconda.  Don’t get me wrong I think Anaconda is awesome but many times it is overkill.  If you want to do machine learning then that is the way to go.  If you want to test simple Trend Following algorithms and make portfolio level decisions you don’t need a data science application.

There isn’t a complicated interface to learn.  Its all command line driven from Python’s IDLE.  90% of the source code is revealed for the back-testing software.  Its like one of those see-thru calculators.  You see all the circuits and semiconductors, but in Python.  So you will need to flow through the code to get to the sections that pertain to your test.  Here is a small sample of how you set up the testing parameters for a Donchian Script.


#--------------------------------------------------------------------------------
# If you want to ignore a bunch of non-eseential stuff then
# S C R O L L A L M O S T H A L F W A Y D O W N
#--------------------------------------------------------------------------------
#TradingSimula18.py - programmed by George Pruitt
#Built on the code and ideas from "The Ultimate Algorithmic Tradins System T-Box"
#Code is broken into sections
#Most sections can and should be ignored
#Each trading algorithm must be programmed with this template
#This is the main entry into the platform
#--------------------------------------------------------------------------------
#Import Section - inlcude functions, classes, variables from external modules
#--------------------------------------------------------------------------------
# --- Do not change below here
from getData import getData
from equityDataClass import equityClass
from tradeClass import tradeInfo
from systemMarket import systemMarketClass
from indicators import highest,lowest,rsiClass,stochClass,sAverage,bollingerBands
from indicators import highest,lowest,rsiClass,stochClass,sAverage,bollingerBands,\
adxClass,sAverage2
from portfolio import portfolioClass
from systemAnalytics import calcSystemResults
from utilityFunctions import getDataAtribs,getDataLists,roundToNearestTick,calcTodaysOTE
from utilityFunctions import setDataLists,removeDuplicates
from portManager import portManagerClass,systemMarkTrackerClass
from positionMatrixClass import positionMatrixClass
from barCountCalc import barCountCalc

from sectorClass import sectorClass, parseSectors, numPosCurrentSector,getCurrentSector
#-------------------------------------------------------------------------------------------------
# Pay no attention to these two functions - unless you want to
#-------------------------------------------------------------------------------------------------
def exitPos(myExitPrice,myExitDate,tempName,myCurShares):
global tradeName,entryPrice,entryQuant,exitPrice,numShares,myBPV,cumuProfit
if mp < 0:
trades = tradeInfo('liqShort',myExitDate,tempName,myExitPrice,myCurShares,0)
profit = trades.calcTradeProfit('liqShort',mp,entryPrice,myExitPrice,entryQuant,myCurShares) * myBPV
profit = profit - myCurShares *commission;trades.tradeProfit = profit;cumuProfit += profit
trades.cumuProfit = cumuProfit
if mp > 0:
trades = tradeInfo('liqLong',myExitDate,tempName,myExitPrice,myCurShares,0)
profit = trades.calcTradeProfit('liqLong',mp,entryPrice,myExitPrice,entryQuant,myCurShares) * myBPV
profit = profit - myCurShares * commission;trades.tradeProfit = profit;cumuProfit += profit
trades.cumuProfit = cumuProfit
curShares = 0
for remShares in range(0,len(entryQuant)):curShares += entryQuant[remShares]
return (profit,trades,curShares)

def bookTrade(entryOrExit,lOrS,price,date,tradeName,shares):
global mp,commission,totProfit,curShares,barsSinceEntry,listOfTrades
global entryPrice,entryQuant,exitPrice,numShares,myBPV,cumuProfit
if entryOrExit == -1:
profit,trades,curShares = exitPos(price,date,tradeName,shares);mp = 0
else:
profit = 0;curShares = curShares + shares;barsSinceEntry = 1;entryPrice.append(price);entryQuant.append(shares)
if lOrS == 1:mp += 1;trades = tradeInfo('buy',date,tradeName,entryPrice[-1],shares,1)
if lOrS ==-1:mp -= 1;trades = tradeInfo('sell',date,tradeName,entryPrice[-1],shares,1)
return(profit,curShares,trades)

dataClassList = list()

marketMonitorList,masterDateList,masterDateGlob,entryPrice = ([] for i in range(4))
buy = entry = 1; sell = exit = -1; ignore = 0;
entryQuant,exitQuant,trueRanges,myBPVList = ([] for i in range(4))
myComNameList,myMinMoveList,systemMarketList = ([] for i in range(3))
cond1,cond2,cond3,cond4 = ([] for i in range(4))
marketVal1,marketVal2,marketVal3,marketVal4 = ([] for i in range(4))
portManager = portManagerClass();marketList = getData();portfolio = portfolioClass()
numMarkets = len(marketList);positionMatrix = positionMatrixClass();positionMatrix.numMarkets = numMarkets
firstMarketLoop = True

#----------------------------------------------------------------------------------
# Set up algo parameters here
#----------------------------------------------------------------------------------
startTestDate = 20100101 #must be in yyyymmdd
stopTestDate = 20190228 #must be in yyyymmdd
rampUp = 100 # need this minimum of bars to calculate indicators
sysName = 'Donch-MAX2NSect' #System Name here
initCapital = 500000
commission = 100
Ignore Most Of This Code

Everything is batched processed: set up, pick market or portfolio, run.  Then examine all of the reports.  Here is an example of the sector analysis report.

          Total Profit  Max DrawDown
Currency -------------------------------
BP -14800 19062
SF -8600 53575
AD 4670 11480
DX 10180 10279
EC -9000 16775
JY 10025 18913
CD -19720 21830
-------------------------------------------
Totals: -27245 69223
-------------------------------------------
Energies -------------------------------
CL -40400 55830
HO 80197 23382
NG -14870 28920
RB -45429 61419
-------------------------------------------
Totals: -20502 75957
-------------------------------------------
Metals -------------------------------
GC 27210 36610
SI -1848 2389
HG -2402 2438
PL -16750 25030
PA 27230 38615
-------------------------------------------
Totals: 33440 61472
-------------------------------------------
Grains -------------------------------
S_ 27312 9088
W_ -25538 32600
C_ -1838 12212
BO -8460 9544
SM 390 11250
RR -1390 12060
-------------------------------------------
Totals: -9523 34135
-------------------------------------------
Financials -------------------------------
US 29488 18375
TY 969 12678
TU -2020 3397
FV -2616 4531
ED -4519 4869
-------------------------------------------
Totals: 21302 30178
-------------------------------------------
Softs -------------------------------
SB -1716 19717
KC 15475 44413
CC 540 8090
CT -8705 35660
LB 22269 16586
OJ 4720 8262
-------------------------------------------
Totals: 32583 57976
-------------------------------------------
Meats -------------------------------
LC -18910 24020
LH -31270 35640
FC 14600 25737
-------------------------------------------
Totals: -35580 59550
-------------------------------------------
Sector Analysis

Plus I include EasyLanguage for the majority of the scripts.  Of course without the portfolio level management.  I am working on a new website that will support the new book at TrendFollowingSystems.com.

Please take a look at my latest book – it would make an awesome Christmas present.


MULTI-TIME FRAME – KEEPING TRACK OF DISCRETE TIME FRAMES

Just a quick post here.  I was asked how to keep track of the opening price for each time frame from our original Multi-Time Frame indicator and I was answering the question when I thought about modifying the indicator.  This version keeps track of each discrete time frame.  The original simply looked back a multiple of the base chart to gather the highest highs and lowest lows and then would do a simple calculation to determine the trend.  So let’s say its 1430 on a five-minute bar and you are looking back at time frame 2.  All I did was get the highest high and lowest low two bars back and stored that information as the high and low of time frame 2.  Time frame 3 simply looked back three bars to gather that information.  However if you tried to compare these values to a 10-minute or 15-minute chart they would not match.

In this version, I use the modulus function to determine the demarcation of each time frame.  If I hit the border of the time frame I reset the open, high, low and carry that value over until I hit the next demarcation.  All the while collecting the highest highs and lowest lows.  In this model, I am working my way from left to right instead of right to left.  And in doing so each time frame is discrete.

Let me know which version you like best.


Inputs:tf1Mult(2),tf2Mult(3),tf3Mult(4),tf4Mult(5);


vars: mtf1h(0),mtf1l(0),mtf1o(0),mtf1c(0),mtf1pvt(0),diff1(0),
mtf2h(0),mtf2l(0),mtf2o(0),mtf2c(0),mtf2pvt(0),diff2(0),
mtf3h(0),mtf3l(0),mtf3o(0),mtf3c(0),mtf3pvt(0),diff3(0),
mtf4h(0),mtf4l(0),mtf4o(0),mtf4c(0),mtf4pvt(0),diff4(0),
mtf0pvt(0),diff0(0);

If barNumber = 1 then
Begin
mtf1o = o;
mtf2o = o;
mtf3o = o;
mtf4o = o;
end;


If barNumber > 1 then
Begin

Condition1 = mod((barNumber+1),tf1Mult) = 0;
Condition2 = mod((barNumber+1),tf2Mult) = 0;
Condition3 = mod((barNumber+1),tf3Mult) = 0;
Condition4 = mod((barNumber+1),tf4Mult) = 0;

mtf1h = iff(not(condition1[1]),maxList(high,mtf1h[1]),high);
mtf1l = iff(not(condition1[1]),minList(low,mtf1l[1]),low);
mtf1o = iff(condition1[1],open,mtf1o[1]);
mtf1c = close;


mtf0pvt = (close + high + low) / 3;
diff0 = close - mtf0pvt;

mtf2h = iff(not(condition2[1]),maxList(high,mtf2h[1]),high);
mtf2l = iff(not(condition2[1]),minList(low,mtf2l[1]),low);
mtf2o = iff(condition2[1],open,mtf2o[1]);
mtf2c = close;


mtf1pvt = (mtf1h+mtf1l+mtf1c) / 3;
diff1 = mtf1c - mtf1pvt;

mtf2pvt = (mtf2h+mtf2l+mtf2c) / 3;
diff2 = mtf2c - mtf2pvt;

mtf3h = iff(not(condition3[1]),maxList(high,mtf3h[1]),high);
mtf3l = iff(not(condition3[1]),minList(low,mtf3l[1]),low);
mtf3o = iff(condition3[1],open,mtf3o[1]);
mtf3c = close;

mtf3pvt = (mtf3h+mtf3l+mtf3c) / 3;
diff3 = mtf3c - mtf3pvt;

mtf4h = iff(not(condition4[1]),maxList(high,mtf4h[1]),high);
mtf4l = iff(not(condition4[1]),minList(low,mtf4l[1]),low);
mtf4o = iff(condition4[1],open,mtf4o[1]);
mtf4c = close;

mtf4pvt = (mtf4h+mtf4l+mtf4c) / 3;
diff4 = mtf4c - mtf4pvt;


Condition10 = diff0 > 0;
Condition11 = diff1 > 0;
Condition12 = diff2 > 0;
Condition13 = diff3 > 0;
Condition14 = diff4 > 0;

If condition10 then setPlotColor(1,Green) else SetPlotColor(1,Red);
If condition11 then setPlotColor(2,Green) else SetPlotColor(2,Red);
If condition12 then setPlotColor(3,Green) else SetPlotColor(3,Red);
If condition13 then setPlotColor(4,Green) else SetPlotColor(4,Red);
If condition14 then setPlotColor(5,Green) else SetPlotColor(5,Red);

condition6 = condition10 and condition11 and condition12 and condition13 and condition14;
Condition7 = not(condition10) and not(condition11) and not(condition12) and not(condition13) and not(condition14);

If condition6 then setPlotColor(7,Green);
If condition7 then setPlotColor(7,Red);

If condition6 or condition7 then plot7(7,"trend");

Plot6(5,"line");
Plot1(4,"t1");
Plot2(3,"t2");
Plot3(2,"t3");
Plot4(1,"t4");
Plot5(0,"t5");

end;
Multi-Time Frame with Discrete Time Frames