
For all of you who want to open multiple text files from within VBA here is the code that will do just that. Here I open a Open File Dialog and enable multiple file selection. I then parse the return string to gather the path and individual file names. The data is then processed – I am looking for a file with a date and a value separated by a comma. You can basically do anything you want with VBA and you also have the EXCEL functions right at your fingertips. Plus output to a worksheet is ultra simple.
Category Archives: Free EasyLanguage
Day Of Week Analysis using a Method In EasyLanguage
One metric that seems to be missing from TradeStation is a Day Of Week analysis. It would be nice, but I don’t know how helpful, to know the $P/L breakdown on a weekday basis; does your system make all of its money on Mondays and Fridays? I created the code that will print out to the print log using an EasyLanguage method. A method is a subroutine that can be included in the main code (strategy, indicator, etc.,.) The global parameters to the main program can be seen inside the method. You can localize variable scope to the method by declaring the variable within the method’s body. A method is a great way to modularize your programming, but it is not the best way to reuse software; the method is accessible only to the main program. This EasyLanguage also utilizes an array and shows a neat piece of code to access the array elements and align them with the day of the week. The dayOfWeek() function returns [1..5] depending on what day of the week the trading day falls on. Monday = 1 and Friday = 5. The array has five elements and each element accumulates the $P/L for each of the five days based on when the trade was initiated.
Here is an example of the print out created by running this simple EasyLanguage strategy. Maybe don’t trade on Monday? Or is that curve fitting. This is an interesting tool and might carry more weight if applied to day trade algorithm. Maybe!
- Monday -8612.50
- Tuesday 6350.00
- Wednesday 2612.50
- Thursday -937.50
- Friday -1987.50
Connors and Raschke (Momentum Pinball)™ EasyLanguage
In the Connors Raschke book, “Street Smarts – High Probability Short-Term Trading Strategies” published by M. Gordon Publishing Group 1995, the authors describe a strategy that incorporates several ideas and functions that can be difficult to program into TradeStation. I highly suggest purchasing the book as it has some very interesting ideas and comes from the minds of two very accomplished traders.
The strategy is conceptually simple and uses the Taylor Buy/Sell day concept. On buy days, buy on the penetration of the first hour high and use the extreme of the first hour as the stop. If you get stopped out the system will allow you to re-enter once more on a re-penetration of the first hour high. If the trade is profitable at the close of the day session then exit on the open of the following day. Selling short is just the opposite. The Buy Day is defined when the three day RSI of the one day ROC (close[0] – close[1]) is below 30 and the Sell Day is defined when this indicator rises above 70. As you can see, pretty simply.
The first problem when programming this strategy is the mixing of the 5 minute bars (for trade execution) and daily bars (calculating the indicator.) How do you calculate an RSI(c[0] – c[1],3) indicator value when looking at a 5 minute bar chart. This turns out to be pretty simple since TradeStation allows the mixing of different time frames on the same chart. First plot a 5 minute bar of the @ES.D as data 1 and then insert a daily bar of the @ES.D as data 2. The first step in programming this strategy is setting up the indicator.
Notice how I declared the variable rsiVal? I initially set it to zero and tie it to data2. This tying or aliasing limits the variable from being updated on each five minute bar. Remember we want the RSI calculation done on the daily bars. The RSI function allows the embedding of calculations as well as different prices. Here we are telling the computer to look at the momentum of today’s close versus yesterday’s and apply the RSI 3 – period calculation.
In their book Connors and Raschke determined that it would be better to buy after an RSI reading of below 30 and sell after an RSI above 70. Once we have this set, then the fun really begins with this type of programming. If you can do this type of programming, there’s very little you can’t do. This is because we are solving a few limitations of EasyLanguage by logically addressing the what we need from language. In this example, we have to capture the range of the first hour. There really isn’t a built-in way to do this or at least not an easy one. When testing intra-day, I always like using five minute bars. This time frame is small enough that not much usually happens during this t time and it isn’t much of a resource hog – like say minute or smaller bars. Since there are 12 five minute bars in an hour, I wait until the 12th bar of the day is completed to determine the first hour’s range and its extremes. I set the dayBarCount to zero on the first bar of the day and then increment the variable on each bar.
TradeStation has made this process simpler by providing the highD and lowD functions. When you call these functions the current daily bar extremes are returned at the point in the day. So the functions are called on the 12th bar and they return the high and low of the first hour. The functions are not called again until the next day. Oh yeah – passing a zero as the function argument informs EasyLanguage to return today’s values. A 1 would return yesterday’s values. These are nifty functions if you aren’t incorporating a secondary daily data stream. Even if you are, like in our example, they still come in handy.
I also keep track of the number of buys and shorts for the day. The books states that a re-entry is possible, so I allow up to two trade entries. I look and the current MP value and its prior value to see if the system went from one state to another. If current MP is long and the prior reading is not long, then a long entry was undoubtedly entered. You can use this logic (I did for illustrative purposes) or use the built-in functions entriesShortToday/entriesLongToday to determine the number of trades for the day. If the rsiValue < 30 and less than two long entries have occurred, then you can buy on a breakout of the first hourly bar. Entering short is the opposite, but with the RSI reading of greater than 70.
The buy/sell levels are the first hourly bar’s extreme +/- min. tick. These levels are used as protective stops as well as entry levels. If long then the first hourly bar’s low is the protective stop. Notice how I check at 1510 if the trade is in a profit by examining the current openPositionProfit. I am checking five minutes prior to the close because I need to execute setExitOnClose if in a loss. I don’t think I can check at 15:15 (closing time) and then exit, but I will check and let you know.
The last little trick is to execute on the open tick the next morning. I have explained in my books the different trading paradigms where you are either sitting on the prior bar when you place orders or sitting on the open of the current bar. EasyLanguage assumes the former so you always have to place an order for the next bar. If you wait until the open, then the earliest you can exit is 8:35. So you have to issue the order on the last bar of the prior day to get the open tick, hence the test to see if the time stamp is 15:15.
This sample of EasyLanguage is a good example of some easy fixes to things that usually leave beginning EasyLanguage coders scratching their heads and groaning out loud.
Trade Entry/Exit Functions in PSB
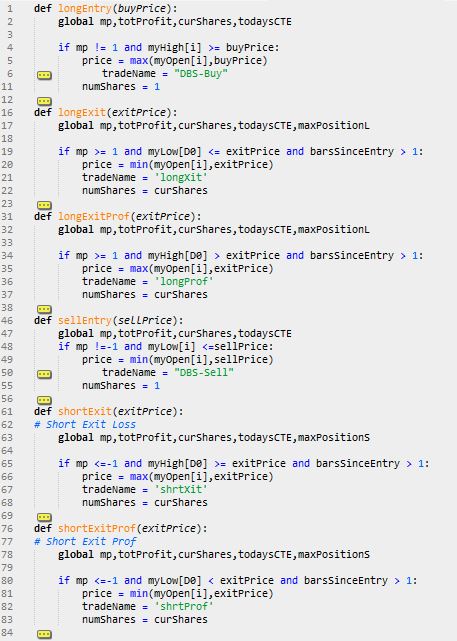
Since Python doesn’t allow for a GOTO program flow structure I changed the inline trade entry/exit logic into function calls. This allows for the call of these functions to be non-sequential. The original PSB order placement was sequential and would examine the entry/exit logic in TOP-DOWN fashion. Meaning that if you put the Long Entry Logic first, the program would evaluate that logic first on every bar of data. This was fine for the majority of trading systems out there. However, systems that could enter multiple signals on the same bar require the orders to be placed in order of whichever was closest to the current market price. Let’s say you have a trading algorithm that issues a stop to exit at a loss and a stop to reverse your current position. If you examine the reversal logic prior to the stop loss and the stop loss is actually closer, then you will execute the wrong signal first. By encapsulating the entry/exit logic into functions you can use decision constructs to flow through the correct logic in the correct order. Here are the trade signals programmed as function calls:

As you can see there are six modules – Long Entry, Long Loss, Long Profit, Short Entry, Short Loss, and Short Profit (note non-necessary code was collapsed). I used the Sublime text editor to collapse the unnecessary lines of code. You can download a trail version from their website. I am no longer using the IDLE as my go to IDE – I have fallen deeply in love with PyScripter. I will delve into this subject later.
Now that you have all your trade signals programmed as functions you can utilize if-thens to determine what order they are called. Here is the code that calls these functions

If you are flat and you can buy or sell on the same day then you call both functions. This back tester will allow you to buy and sell on the same day – the only problem is it doesn’t know which occurred first: the buy or the sell. This can cause a problem because you need to know the correct position by the end of the day. Since we can peak into the future (be very, very careful) we can look at the close of the day and compare it with the long and short entry prices. Here is some code that might make your entries more accurate on those occasions where both orders could be filled.
This code will execute the long entry logic after the short entry logic whenever the close is closer to the long entry price than the short entry price. If both orders are filled on the same bar and the close happens to fall closer to the long entry price, then the software assumes the short entry was entered earlier in the day and the long entry later in the day making the position at end of day long. Is this 100% accurate? No but it logically stands to reason that a close near the high would indicate they high was made last. Without intraday data we simply do not know what happened first.
Using Jupyter Notebook and Plot.ly To Create Candle Stick Chart
In today’s post I show how you can plot a very nice looking Candlestick chart inside a Jupyter (IPython) notebook. This chore is
made much easier by using Plotly. So first thing you sholud do is sign up for a free account at Plotly and then download Jupyter Interactive Python notebooks. I did this in an interactive notebook for demonstration purposes only. After installing Plotly I was able to import the libraries into my notebook and then call the various functions to graph the data. I imported numpy, but it wasn’t necessary. I simply copied some data (CL.CSV) to the subdirectory that held my notebooks and then used the CSV Reader to pull the data into the various lists that the Plotly functions required. All of the plotting is done in a browser and its interactive. After creating the PSB I wanted to provide a tool for plotting the data that was being tested. Jupyter and Plotly are free for non-commercial users.

Restructuring Trade Entry with PSB
It has been brought to my attention by a very astute reader of the book that the ordering of the buy/sell/longliq/shortliq directives creates a potential error by giving preference to entries. The code in the book and my examples thus far test for a true condition first in the entry logic and then in the exit logic. Let’s say your long exit stop in the Euros is set at 11020, but your reversal is set at 11000. The python back tester will skip the exit at 11020 and reverse at 11000. This only happens if both stops are hit on the same day. If this happens you will incur a 20 point additional loss. You can prevent this by using logic similar to:
Notice bow I compare the price level of stb and stopb [stb – reversal and stopb – liquidation]. I added this to the long entry logic – the code is only executed if the entry is less than the exit (closer to the current market). I am in the process of restructuring the flow so that all orders will be examined on a bar by bar basis and the ones that should take place (chronologically speaking) will do so and be reflected in the performance metrics. This can cause multiple trades on a single bar. This is what happens in real trading and should be reflected in the PSB. This is where the lack of a GOTO creates a small headache in Python. The ESB already takes this into consieration. I will post when I finalize the code.
Version 2.0 of Python System Back-tester Available
I have just wrapped up the latest version of the Python System Back-tester (PSB).
I have added some more portfolio performance metrics and you will see these in the performance reports. The most useful addition is the concept of the .POR file when you run a system. Instead of having to select your data files each time you run a system, you can build a .POR file with a list of files/markets you want to batch run.
Here is an example of a Portfolio file:
TY.CSV
CU.CSV
SB.CSV
S2.CSV
QG.CSV
QM.CSV
C2.CSV
Just make sure you put the .POR file inside the same folder that contains your testing data. I have included a TestPortfolio.por file in version 2.0. I would treat the different versions as completely separate applications. Your existing .py algorithm files will need to be slightly modified to work with version 2.0.
This line of code needs to be modified from this:
systemMarket.setSysMarkInfo(sysName,myComName,listOfTrades,equity)
to this:
systemMarket.setSysMarkInfo(sysName,myComName,listOfTrades,equity,initCapital)
This line is near the bottom of the overall loop. I added the initCapital variable so you could do position sizing and the performance metrics would reflect this initial value.
And set initCapital to a pertinent value. I put it right below the sysName variable:
sysName = ‘BollingerBandSys’ #System Name here
initCapital = 100000 #starting account balance
Also I corrected a small bug in the main loop. You should change this:
for i in range(len(myDate) – numBarsToGoBack,len(myDate)):
to
for i in range(len(myDate) – (numBarsToGoBack-rampUp),len(myDate)):
In another post I will show how the portfolio performance metrics have changed. I hope you like the new version. I will be adding a library of trading systems utilizing this new version in a few days.
If you want to download Version 2.0 – just go the the following link
If You Can Do This – You Can Test Any Algorithm!
All the unnecessary lines of the Python System Back-Testing Module have been hidden. Only the lines that you need to develop the next great algorithm are included. Reads sort of like English. This snippet introduces you to the use of functions and lists – two major components of the Python language. If you buy my latest book – “The Ultimate Algorithmic Trading System Toolbox” then simply email me or sign up through the contact form and you will get version 2.0 for free!

Macintosh version of Excel System Back-Tester Available
It was recently brought to my attention that the Excel System Back-Tester(ESB) did not function properly on the MAC OS X. In other words it bombed when trying to open a comma delimited data file and also when one tried to run an algorithm. Thanks to a purchaser of the UATSTB I was able to fix the bugs without removing any functionality. I will post the Macintosh version here as well as have WILEY put it on the book’s website. Sorry for any inconvenience this may have caused. Here is the the link:
Turtle Volatility Loss in Python Back Tester – Part 3 in Series
The Turtle N or Volatility is basically a 20-day Average True Range in terms of Dollars. This amount is considered the market volatility. In other words the market, based on the average, can either move up or down by this amount. It can move much less or much further; this is just an estimate. If the market moves 2 N against a position, then as a Turtle you were to liquidate your stake in that commodity. The logic indicates that if the market has a break out and then moves 2 N in the opposite direction, then the break out has failed. First the code must be defined to represent the market volatility. This is simple enough by using the sAverage function call and passing it the trueRanges and 20 days. There’s no use in converting this to dollars because what we want is a price offset. Once a position is entered the turtleN is either added to the price [short position] or subtracted from the price [long position] to determine the respective stop levels. Look at lines 2, 8 and 17 to see how this is handled. An additional trade code block must be added to facilitate this stop. Lines 17 to 28 takes care of exiting a long position when the market moves 2 N in the opposite direction. This new stop is in addition to the highest/lowest high/low stops for the past 10 -20 days.


