SuperTrend is a trading strategy and indicator all built into one entity. There are a couple of versions floating around out there. MultiCharts and Sierra Chart both have slightly different flavors of this combo approach.
Ratcheting Trailing Stop Paradigm
This indic/strat falls into this category of algorithm. The indicator never moves away from your current position like a parabolic stop or chandelier exit. I used the code that was disclosed on Futures.io or formerly known as BigMikesTrading blog. This version differs from the original SuperTrend which used average true range. I like Big Mike’s version so it will discussed here.
Big Mike’s Math
The math for this indicator utilizes volatility in the terms of the distance the market has travelled over the past N days. This is determined by calculating the highest high of the last N days/bars and then subtracting the lowest low of last Ndays/bars. Let’s call this the highLowRange. The next calculation is an exponential moving average of the highLowRange. This value will define the market volatility. Exponential moving averages of the last strength days/bars highs and lows are then calculated and divided by two – giving a midpoint. The volatility measure (multiplied my mult) is then added to this midpoint to calculate an upper band. A lower band is formed by subtracting the volatility measure X mult from the midpoint.
Upper or Lower Channel?
If the closing price penetrates the upper channel and the close is also above the highest high of strength days/bars back (offset by one of course) then the trend will flip to UP. When the trend is UP, then the Lower Channel is plotted. Once the trend flips to DN, the upper channel will be plotted. If the trend is UP the lower channel will either rise with the market or stay put. The same goes for a DN trend – hence the ratcheting. Here is a graphic of the indicator on CL.
Super Trend by Bike Mike
If you plan on using an customized indicator in a strategy it is always best to build the calculations inside a function. The function then can be used in either an indicator or a strategy.
Function Name: SuperTrend_BM
Function Type: Series – we will need to access prior variable values
if trend < 0 and trend[1] > 0 then trendDN = True; if trend > 0 and trend[1] < 0 then trendUP = True;
//ratcheting mechanism if trend > 0 then dn = maxList(dn,dn[1]); if trend < 0 then up = minList(up,up[1]);
// if trend dir. changes then assign // up and down appropriately if trendUP then up = xAvg + mult * xAvgRng; if trendDN then dn = xAvg - mult * xAvgRng;
if trend = 1 then ST = dn else ST = up;
STrend = trend;
SuperTrend_BM = ST;
SuperTrend ala Big Mike
The Inputs to the Function
The original SuperTrend did include the Strength input. This input is a Donchian like signal. Not only does the price need to close above/below the upper/lower channel but also the close must be above/below the appropriate Donchian Channels to flip the trend, Also notice we are using a numericRef as the type for STrend. This is done because we need the function to return two values: trend direction and the upper or lower channel value. The appropriate channel value is assigned to the function name and STrend contains the Trend Direction.
A Function Driver in the Form of an Indicator
A function is a sub-program and must be called to be utilized. Here is the indicator code that will plot the values of the function using: length(9), mult(1), strength(9).
// SuperTrend indicator
// March 25 2010
// Big Mike https://www.bigmiketrading.com
inputs:
length(9), mult(1), strength(9);

vars:
strend(0),
st(0);

st = SuperTrend_BM(length, mult,strength,strend);

if strend = 1 then Plot1(st,"SuperTrendUP");
if strend = -1 then Plot2(st,"SuperTrendDN");
Function Drive in the form of an Indicator
This should be a fun indicator to play with in the development of a trend following approach. My version of Big Mike’s code is a little different as I wanted the variable names to be a little more descriptive.
Update Feb 28 2022
I forgot to mention that you will need to make sure your plot lines don’t automatically connect.
Plot Style Setting
Can You Do This with Just One Plot1?
An astute reader brought it to my attention that we could get away with a single plot and he was right. The reason I initially used two plot was to enable the user to chose his/her own plot colors by using the Format dialog.
//if strend = 1 then Plot1(st,"SuperTrendUP"); //if strend = -1 then Plot2(st,"SuperTrendDN");
if strend = 1 then SetPlotColor(1,red); if strend = -1 then SetPlotColor(1,green);
How important is a day of week analysis? Many pundits would of course state that it is very important, especially when dealing with a day trading algorithm. Others would disagree. With the increase in market efficiency maybe this study is not as important as it once was, but it is another peformance metric that can be used with others.
I am currently working on the second book in the Easing into EasyLanguage trilogy (Hi-Res Edition) and I am including this in one of the tutorials on developing a day trading template. The book, like this post, will focus on intraday data such as 5 or less minute bars. I hope to have the book finalized in late November. If you haven’t purchased the Foundation Edition and like this presentation, I would suggest picking a copy up – especially if you are new to EasyLanguage. The code for this analysis is quite simple, but it is pretty cool and can be re-used.
Day Trading Algorithms Make Things Much More Simple
When you enter and exit on the same day and you don’t need to wrap around a 00:00 (midnight) time stamp, things such as this simple snippet of code are very easy to create. The EasyLanguage built-in functions work as you would expect as well. And obtaining the first bar of the day is ultra simple. The idea here is to have five variables, one for each day of the week, and accumulate the profit that is made on each day, and at the end of the run print out the results. Three things must be known on the first bar of the new trading day to accomplish this task:
were trades taken yesterday?
how much profit was made or lost?
what was yesterday – M, T, W, R, or F?
Two Reserved Words and One Function Are Used: Total Trades, NetProfit and the DayOfWeek function.
The reserved word TotalTrades keeps track of when a trade is closed out. The second reserved word, NetProfit keeps track of total profit everytime a trade is closed out. Along with the DayOfWeek(D[1]) function you can capture all the information you need for this analysis. Here is the code. I will show it first and then explain it afterwards.
	if date <> date[1] then
	begin
		myBarCount = 0;
		buysToday = 0;sellsToday = 0;
		zatr = avgTrueRange(atrLen) of data2;
		if totalTrades > totTrades then
		begin
			Print(d," ",t," trade out ",dayOfWeek(d[1])," ",netProfit);
			switch(dayOfWeek(date[1]))
			begin
				Case 1: MProf = MProf + (netProfit - begDayEquity);
				Case 2: TProf = TProf + (netProfit - begDayEquity);
				Case 3: WProf = WProf + (netProfit - begDayEquity);
				Case 4: RProf = RProf + (netProfit - begDayEquity);
				Case 5: FProf = FProf + (netProfit - begDayEquity);
				Default: Value1 = Value1 + 1;
			end;
			begDayEquity = netProfit;
			totTrades = totalTrades;
		end;
	end;
Snippet To Handle DofW Analysis on DayTrading Algorithm
Code Explanation – Switch and Case
I have used the Switch – Case construct in some of my prior posts and I can’t emphasize enough how awesome it is, and how you can cut down on the use of if – thens. This snippet only takes place on the first bar of the trading day. Since we are using day sessions we can simply compare today’s date to the prior bar’s date, and if they are different then you know you are sitting on the first intraday bar of the day. After some initial housekeeping, the first if – then checks to see if trade(s) were closed out yesterday. If totalTrades is greater than my user defined totTrades, then something happened yesterday. My totTrades is updated to totalTrades after I am done with my calculations. The switch keys off of the DayOfWeek function. Remember you should account for every possible outcome of the variable inside the switch expression. In the case of the DayOfWeek function when know:
Monday
Tuesday
Wednesday
Thursday
Friday
Notice I am passing Date[1] into the function, because I want to know the day of the week of yesterday. After the Switch and its associated expression you have a Begin statement. Each outcome of the expression is preceded withthe keyword Case followed by a colon (:). Any code associated with each distinct result of the expression is sandwiched between Case keywords. So if the day of week of yesterday is 1 or Monday then MProf accumulates the change in the current NetProfit and the begDayEquity (beginning of the yesterday’s NetProfit) variable. So, if the equity at the beginning of yesterday was $10,000 and there was a closed out trade and the current NetProfit is $10,500 then $500 was made by the end of the day yesterday. This exact calculation is used for each day of the week and stored in the appropriate day of the week variable:
MProf – Monday
TProf – Tuesday
WProf – Wednesday
RProf – Thursday
FProf – Friday
You might ask why RProf for Thursday? Well, we have already used TProf for Tuesday and Thursday contains an “R”. This is just my way of doing it, but you will find this often in code dealing with days of the week. Every Switch should account for every possible outcome of the expression its keying off of. Many times you can’t always know ahead of time all the possible outcomes, so a Default case should be used as an exception. It is not necessary and it will not kick an error message if its not there. However, its just good programming to account for everything. Once the Switch is concluded begDayEquity and totTrades are updated for use the following day.
Here is the code that prints out the results of the DayOfWeek Analysis
if d = 1211027 and t = 1100 then
begin
	print(d," DOW Analysis ");
	print("Monday    : ",MProf);
	print("Tuesday   : ",TProf);
	print("Wednesday : ",WProf);
	print("Thursday  : ",RProf);
	print("Friday    : ",FProf);

end;
Printing The Results of DofW Analysis
The printout occurs on October 27, 2021 at 11 AM. Here is my analysis of a day trading algorithm I am working on, tested over the last two years on 5 minute bars of the @ES.D
This System Will Be Published in the Hi-Res Edition of Easing into EasyLanguage Trilogy
Looks like it does. These results were derived from one of the Tutorials in The Hi-Res edition of EZ-NG-N2-EZ-LANG trilogy. I should have it availabe at Amazon some time in late November. Of course if you have any questions just email me @ george.p.pruitt@gmail.com.
Before the days of OOEL and more advanced data structures, such as vectors, you had to work with multidimensional arrays.
The problem with arrays is you have to do all the housekeeping whereas with vectors the housekeeping is handled internally. Yes, vectors in many cases would be the most efficient approach, but if you are already using Multi-D arrays, then mixing the two could become confusing. So stick with the arrays for now and progress into vectors at your leisure.
Recreate the CCI indicator with Multi-D Array
This exercise is for demonstration purposes only as the existing CCI function works just fine. However, when you are trying out something new or in this case an application of a different data structure (array) its always great to check your results against a known entity. If your program replicates the known entity, then you know that you are close to a solution. The CCI function accesses data via the globalHigh, Low and Close data streams and then applies a mathematical formula to derive a result. <
Derive Your Function First
Create the function first by prototyping what the function will need in the formal parameter list (funciton header). The first thing the function will need is the data – here is what it will look like.
OHLCArray[1,1] =1210903.00 // DATE
OHLCArray[1,2] = 4420.25 // OPEN
OHLCArray[1,3] = 4490.25 // HIGH
OHLCArray[1,4] = 4410.25 // LOW
OHLCArray[1,5] = 4480.75 // CLOSE
OHLCArray[2,1] =1210904.00 // DATE
OHLCArray[2,2] = 4470.25 // OPEN
OHLCArray[2,3] = 4490.25 // HIGH
OHLCArray[2,4] = 4420.25 // LOW
OHLCArray[2,5] = 4440.75 // CLOSE
Visualize 2-D Array as a Table
Column 1
Column 2
Column 3
Column 4
Column 5
1210903
44202.25
4490.25
4410.25
4480.75
1210904
4470.25
4490.25
4420.25
4440.76
The CCI function is only concerned with H, L, C and that data is in columns 3, 4, 5. If you know the structure of the array before you program the function, then you now which columns or fields you will need to access. If you don’t know the structure beforehand , then that information would need to be passed into the function as well. Let us assume we know the structure. Part of the housekeeping that I mentioned earlier was keeping track of the current row where the latest data is being stored. This “index” plus the length of the CCI indicator is the last two things we will need to know to do a proper calculation.
CCI_2D Function Formal Parameter List
// This function needs data, current data row, and length
// Notice how I declare the OHLCArray using the dummy X and Y
// Variable - this just tells TradeStation to expect 2-D array
// ------------------
//                | |
//                * *
inputs: OHLCArray[x,y](numericArray), currentRow(numericSimple), length(numericSimple);
//                         ***
//                         |||
//----------------------------
// Also notice I tell TradeStation that the array is of type numeric
// We are not changing the array but if we were, then the type would be
// numericArrayRef - the actual location in memory not just a copy
CCI_2D Formal Parameter List
2-D Array Must Run Parallels with Actual Data
The rest of the function expects the data to be just like the H, L, C built-in data – so there cannot be gaps. This is very important when you pack the data and you will see this in the function driver code a.k.a an indicator. The data needs to align with the bars. Now if you are using large arrays this can slow things down a bit. You can also shuffle the array and keep the array size to a minimum and I will post how to do this in a post later this week. The CCI doesn’t care about the order of the H,L,C as long as the last N element is the latest values.
if AvgDev = 0 then CCI_2D = 0 else CCI_2D = ( value1 + value2 + value3 - Mean ) / ( .015 * AvgDev ) ;
CCI-2D Function
This function could be streamlined, but I wanted to show you how to access the different data values with the currentRow variable and columns 3, 4, and 5. I extract these data and store them in Values variables. Notice the highlighted line where I check to make sure there are enough rows to handle the calculation. If you try to access data before row #1, then you will get an out of bounds error and a halt to program execution.
Notice lines 16 and 17 where I am plotting both function results – my CCI_2D and CCI. Also notice how I increment numRows on each bar – this is the housekeeping that keeps that array synched with the chart. In the following graphic I use 14 for CCI_2D and 9 for the built-in CCI.
Two CCI functions with different Lengths
Now the following graphic uses the same length parameters for both functions. Why did just one line show up?
Both CCI Functions with same Lengths – were did second line go to?
Make Your Unique Coding Replicate a Known Entity – If You Can
Here is where your programming is graded. The replication of the CCI using a 2-D Array instead of the built-in H, L, C data streams, if programmed correctly, should create the exact same results and it does, hence the one line. Big Deal right! Why did I go through all this to do something that was already done? Great programming is not supposed to re-invent the wheel. And we just did exactly that. But read between the lines here. We validated code that packed a 2-D array with data and then passed it to a function that then accessed the data correctly and applied a known formula and compared it to a known entity. So now you have re-usable code for passing a 2-D array to a function. All you have to do is use the template and modify the calculations. Re-inventing the wheel is A-Okay if you are using it as a tool for validation.
Hello to All! I just published the first book in this series. It is the Foundation Edition and is designed for the new user of EasyLanguage or for those you would like to have a refresher course. There are 13 total tutorials ranging from creating Strategies to PaintBars. Learn how to create your own functions or apply stops and profit objectives. Ever wanted to know how to find an inside day that is also a Narrow Range 7 (NR7?) Now you can, and the best part is you get over 4 HOURS OF VIDEO INSTRUCTION – one for each tutorial. Each video is created by yours truly and Beau my trustworthy canine companion. I go over every line of code to really bring home the concepts that are laid out in each tutorial. All source code is available too, and if you have TradeStation, so are the workspaces. Plus you can always email George for any questions. george.p.pruitt@gmail.com.
The Cover of my latest book. The first in the series.
If you like the information on my blog, but find the programming code a little daunting, then go back and build a solid foundation with the Foundation Edition. It starts easy but moves up the Learning Curve at comfortable pace. On sale now for $24.95 at Amazon.com. I am planning on having two more advanced books in the series. The second book, specifically designed for intraday trading and day-trading, will be available this winter. And the third book, Advanced Topics, will be available next spring.
Pick up your copy today – e-Book or Paperback format!
Let me know if you buy either format and I will send you a PDF of the source code – just need proof of purchase. With the PDF you can copy and paste the code. After you buy the book come back here to the Easing Into EasyLanguage Page and download the ELD and workspaces.
The theory behind the code is quite interesting and I haven’t gotten into it thoroughly, but will do so in the next few days. The code was derived from Trade-Signal’s Equilla Programming Language. I looked at the website and it seems to leans heavily on an EasyLanguage like syntax, but unlike EZLang allows you to incorporate indicators right in the Strategy. It also allows you, and I might be wrong, to move forward in time from a point in the past quite easily. The code basically was fed a signal (+1,0,-1) and based on this value progressively moved forward one bar at a time (over a certain time period) and calculated the MAE and MFE (max. adverse/favorable excursion for each bar. The cumulative MAE/MFE were then stored in a BIN for each bar. At the end of the data, a chart of the ratio between the MAE and MFE was plotted.
EasyLanguage Version
I tried to replicate the code to the best of my ability by going back in time and recording a trading signal and then moving Back to The Future thirty bars, in this case, to calculated and store the MAE/MFE in the BINS.
Simple Moving Average Cross Over Test
After 100 bars, I looked back 30 bars to determine if the price was either greater than or less than the 21 day moving average. Let’s assume the close was greater than the 21 day moving average 30 days ago, I then kept going backward until this was not the case. In other words I found the bar that crossed the moving average. It could have been 5 or 18 or whatever bars further back. I stored that close and then started moving forward calculating the MAE/MFE by keeping track of the Highest Close and Lowest Close made during 30 bar holding period. You will see the calculation in the code. Every time I got a signal I accumulated the results of the calculations for each bar in the walk forward period. At the end of the chart or test I divided each bars MFE by its MAE and plotted the results. A table was also created in the Print Log. This code is barely beta, so let me know if you see any apparent errors in logic or calculations.
inputs: ilb(30); //ilb - initial lookback
vars: lb(0),signal(0),btf(0),mf(0),ma(0),hh(0),ll(99999999),arrCnt(0),numSigs(0);
arrays : mfe[40](0),mae[40](0);
lb = ilb;
if barNumber > 100 then
begin
	signal = iff(c[ilb] > average(c[ilb],21),1,-1);
//	print(d," signal ",signal," ",ilb);
	if  signal <> signal[1] then
	begin
		numSigs = numSigs + 1; // keep track of number of signals
//		print("Inside loop ", date[ilb]," ",c[ilb]," ",average(c[ilb],21));
		if signal = 1 then // loop further back to get cross over
		begin
//			print("Inside signal = 1 ",date[lb]," ",c[lb]," ",average(c[lb],21));
			while c[lb] > average(c[lb],21)
			begin
				lb = lb + 1;
			end;
//			print("lb = ",lb);
		end;

		if signal = -1 then // loop further back to get cross over
		begin
//			print("Inside signal = -1 ",date[lb]," ",c[lb]," ",average(c[lb],21));
			while c[lb] < average(c[lb],21)
			begin
				lb = lb + 1;
			end;
		end;
		lb = lb - 1;

		hh = 0;
		ll = 999999999;

		arrCnt = 0;
		for btf = lb downto (lb - ilb) //btf BACK TO FUTURE INDEX
		begin
			mf=0;
			ma=0;
			hh=maxList(c[btf],hh);
//			print("inside inner loop ",btf," hh ",hh," **arrCnt ",arrCnt);
			ll=minList(c[btf],ll);
			if signal>0 then
			begin
				mf=iff(hh>c[lb],(hh-c[lb])/c[lb],0); // mf long signal
				ma=iff(ll<c[lb],(c[lb]-ll)/c[lb],0); // ma long signal
			end;
			if signal<0 then begin
				ma=iff(hh>c[lb],(hh-c[lb])/c[lb],0); // ma after short signal
				mf=iff(ll<c[lb],(c[lb]-ll)/c[lb],0); // mf after short signal
			end;
//			print(btf," signal ",signal," mf ",mf:0:5," ma ",ma:0:5," hh ",hh," ll ",ll," close[lb] ",c[lb]);
			mfe[arrCnt]=mfe[arrCnt]+absValue(signal)*mf;
			mae[arrCnt]=mae[arrCnt]+absValue(signal)*ma;
			arrCnt = arrCnt + 1;
		end;
	end;
end;

if lastBarOnChart then
begin
    print(" ** MFE / MAE ** ");
	for arrCnt = 1 to 30
	begin
		print("Bar # ",arrCnt:1:0," mfe / mae ",(mfe[arrCnt]/mae[arrCnt]):0:5);
	end;

	for arrCnt = 30 downto 1
	begin
		plot1[arrCnt](mfe[31-arrCnt]/mae[31-arrCnt]," mfe/mae ");
	end;
end;
Back to The Future - going backward then forward
Here is an output at the end of a test on Crude Oil
 ** MFE / MAE **
Bar # 1 mfe / mae 0.79828
Bar # 2 mfe / mae 0.81267
Bar # 3 mfe / mae 0.82771
Bar # 4 mfe / mae 0.86606
Bar # 5 mfe / mae 0.87927
Bar # 6 mfe / mae 0.90274
Bar # 7 mfe / mae 0.93169
Bar # 8 mfe / mae 0.97254
Bar # 9 mfe / mae 1.01002
Bar # 10 mfe / mae 1.03290
Bar # 11 mfe / mae 1.01329
Bar # 12 mfe / mae 1.01195
Bar # 13 mfe / mae 0.99963
Bar # 14 mfe / mae 1.01301
Bar # 15 mfe / mae 1.00513
Bar # 16 mfe / mae 1.00576
Bar # 17 mfe / mae 1.00814
Bar # 18 mfe / mae 1.00958
Bar # 19 mfe / mae 1.02738
Bar # 20 mfe / mae 1.01948
Bar # 21 mfe / mae 1.01208
Bar # 22 mfe / mae 1.02229
Bar # 23 mfe / mae 1.02481
Bar # 24 mfe / mae 1.00820
Bar # 25 mfe / mae 1.00119
Bar # 26 mfe / mae 0.99822
Bar # 27 mfe / mae 1.01343
Bar # 28 mfe / mae 1.00919
Bar # 29 mfe / mae 0.99960
Bar # 30 mfe / mae 0.99915
Ratio Values over 30 Bins
Using Arrays for Bins
When newcomers start to program EasyLanguage and encounter arrays it sometimes scares them away. They are really easy and in many cases necessary to complete a project. In this code I used two 40 element or bins arrays MFE and MAE. I only use the first 30 of the bins to store my information. You can change this to 30 if you like, and when you start using a fixed array it is best to define them with the exact number you need, so that TradeStation will tell you if you step out of bounds (assign value to a bin outside the length of the array). To learn more about arrays just search my blog. The cool thing about arrays is you control what data goes in and what you do with that data afterwards. Anyways play with the code, and I will be back with a more thorough explanation of the theory behind it.
Why Can’t I Just Test with Daily Bars and Use Look-Inside Bar?
Good question. You can’t because it doesn’t work accurately all of the time. I just default to using 5 minute or less bars whenever I need to. A large portion of short term, including day trade, systems need to know the intra day market movements to know which orders were filled accurately. It would be great if you could just flip a switch and convert a daily bar system to an intraday system and Look Inside Bar(LIB) is theoretically that switch. Here I will prove that switch doesn’t always work.
Daily Bar System
Buy next bar at open of the day plus 20% of the 5 day average range
SellShort next at open of the day minus 20% of the 5 day average range
If long take a profit at one 5 day average range above entryPrice
If short take a profit at one 5 day average range below entryPrice
If long get out at a loss at 1/2 a 5 day average range below entryPrice
If short get out at a loss at 1/2 a 5 day average range above entry price
Simplified Daily Bar DayTrade System using ES.D Daily
Daily Bar Using 5 min Look Inside Bar
Looks great with just the one hiccup: Bot @ 3846.75 and the Shorted @ 3834.75 and then took nearly 30 handles of profit.
Now let’s see what really happened.
What Really Happened – Bot – Shorted – Stopped Out
Intraday Code to Control Entry Time and Number of Longs and Shorts
Not an accurate representation so let’s take this really simple system and apply it to intraday data. Approaching this from a logical perspective with limited knowledge about TradeStation you might come up with this seemingly valid solution. Working on the long side first.
//First Attempt


if d <> d[1] then value1 = .2 * average(Range of data2,5);
value2 = value1 * 5;
if t > sess1startTime then buy next bar at opend(0) + value1 stop;
setProfitTarget(value2*bigPointValue);
setStopLoss(value2/2*bigPointValue);
setExitOnClose;
First Simple Attempt
This looks very similar to the daily bar system. I cheated a little by using
if d <> d[1] then value1 = .2 * average(Range of data2,5);
Here I am only calculating the average once a day instead of on each 5 minute bar. Makes things quicker. Also I used
if t > sess1StartTime then buy next bar at openD(0) + value1 stop;
I did that because if you did this:
buy next bar at open of next bar + value1 stop;
You would get this:
Cannot Sneak a Peek with Data2
That should do it for the long side, right?
Didn’t work quite right!
So now we have to monitor when we can place a trade and monitor the number of long and short entries.
How does this look!
Correct Execution!
So here is the code. You will notice the added complexity. The important things to know is how to control when an entry is allowed and how to count the number of long and short entries. I use the built-in keyword/function totalTrades to keep track of entries/exits and marketPosition to keep track of the type of entry.
Take a look at the code and you can see how the daily bar system is somewhat embedded in the code. But remember you have to take into account that you are stepping through every 5 minute bar and things change from one bar to the next.
if d <> d[1] then begin curTotTrades = totalTrades; value1 = .2 * average(Range of data2,5); value2 = value1 * 5; buysToday = 0; shortsToday = 0; tradeZoneTime = False; end;
mp = marketPosition;
if totalTrades > curTotTrades then begin if mp <> mp[1] then begin if mp[1] = 1 then buysToday = buysToday + 1; if mp[1] = -1 then shortsToday = shortsToday + 1; end; if mp[1] = -1 then print(d," ",t," ",mp," ",mp[1]," ",shortsToday); curTotTrades = totalTrades; end; if t > sess1StartTime and t < sess1EndTime then tradeZoneTime = True;
if tradeZoneTime and buysToday = 0 and mp <> 1 then buy next bar at opend(0) + value1 stop;
if tradeZoneTime and shortsToday = 0 and mp <> -1 then sellShort next bar at opend(0) - value1 stop;
Proper Code to Replicate the Daily Bar System with Accuracy
Here’s a few trade examples to prove our code works.
Looks Right!
Okay the code worked but did the system?
Uh? NO!
Conclusion
If you need to know what occurred first – a high or a low in a move then you must use intraday data. If you want to have multiple entries then of course your only alternative is intraday data. This little bit of code can get you started converting your daily bar systems to intraday data and can be a framework to develop your own day trading/or swing systems.
Can I Prototype A Short Term System with Daily Data?
You can of course use Daily Bars for fast system prototyping. When the daily bar system was tested with LIB turned on, it came close to the same results as the more accurately programmed intraday system. So you can prototype to determine if a system has a chance. Our core concept buyt a break out, short a break out, take profits and losses and have no overnight exposure sounds good theoretically. And if you only allow 2 entries in opposite directions on a daily bar you can determine if there is something there.
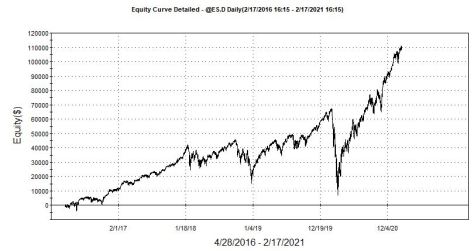
A Dr. Jekyll and Mr. Hyde Scenario
While playing around with this I did some prototyping of a daily bar system and created this equity curve. I mistakenly did not allow any losses – only took profits and re-entered long.
In this post I simply wanted to convert the intraday ratcheting stop mechanism that I previously posted into a daily bar mechanism. Well that got me thinking of how many different values could be used as the amount to ratchet. I came up with three:
I have had requests for the EasyLanguage in an ELD – so here it is – just click on the link and unZip.
So this was going to be a great start to a post, because I was going to incorporate one of my favorite programming constructs : Switch-Case. After doing the program I thought wouldn’t it be really cool to be able to optimize over each scheme the ratchet and trail multiplier as well as the values that might go into each scheme.
In scheme one I wanted to optimize the N days for the ATR calculation. In scheme two I wanted to optimize the $ amount and the scheme three the percentage of a 20 day standard deviation. I could do a stepwise optimization and run three independent optimizations – one for each scheme. Why not just do one global optimization you might ask? You could but it would be a waste of computer time and then you would have to sift through the results. Huh? Why? Here is a typical optimization loop:
Scheme
Ratchet Mult
Trigger Mult
Parameter 1
1 : ATR
1
1
ATR (2)
2 : $ Amt
1
1
ATR (2)
3 : % of Dev. Amt
1
1
ATR (2)
1 : ATR
2
1
ATR (2)
2 : $ Amt
2
1
ATR (2)
Notice when we switch schemes the Parameter 1 doesn’t make sense. When we switch to $ Amt we want to use a $ Value as Parameter 1 and not ATR. So we could do a bunch of optimizations across non sensical values, but that wouldn’t really make a lot of sense. Why not do a conditional optimization? In other words, optimize only across a certain parameter range based on which scheme is currently being used. I knew there wasn’t an overlay available to use using standard EasyLanguage but I thought maybe OOP, and there is an optimization API that is quite powerful. The only problem is that it was very complicated and I don’t know if I could get it to work exactly the way I wanted.
EasyLanguage is almost a full blown programming language. So should I not be able to distill this conditional optimization down to something that I could do with such a powerful programming language? And the answer is yes and its not that complicated. Well at least for me it wasn’t but for beginners probably. But to become a successful programmer you have to step outside your comfort zones, so I am going to not only explain the Switch/Case construct (I have done this in earlier posts) but incorporate some array stuff.
When performing conditional optimization there are really just a few things you have to predefine:
Scheme Based Optimization Parameters
Exact Same Number of Iterations for each Scheme [starting point and increment value]
Complete Search Space
Total Number of Iterations
Staying inside the bounds of your Search Space
Here are the optimization range per scheme:
Scheme #1 – optimize number of days in ATR calculation – starting at 10 days and incrementing by 2 days
Scheme #2 – optimize $ amounts – starting at $250 and incrementing by $100
Scheme #3 – optimize percent of 20 Bar standard deviation – starting at 0,25 and incrementing by 0.25
I also wanted to optimize the ratchet and target multiplier. Here is the base code for the daily bar ratcheting system with three different schemes. Entries are based on penetration of 20 bar highest/lowest close.
if volBase then begin ratchetAmt = avgTrueRange(volCalcLen) * ratchetMult; trailAmt = avgTrueRange(volCalcLen) * trailMult; end; if dollarBase then begin ratchetAmt =dollarAmt/bigPointValue * ratchetMult; trailAmt = dollarAmt/bigPointValue * trailMult; end; if devBase then begin ratchetAmt = stddev(c,20) * devAmt * ratchetMult; trailAmt = stddev(c,20) * devAmt * trailMult; end;
if c crosses over highest(c[1],20) then buy next bar at open; if c crosses under lowest(c[1],20) then sellshort next bar at open;
mp = marketPosition; if mp <> 0 and mp[1] <> mp then begin longMult = 0; shortMult = 0; end;
If mp = 1 then lep = entryPrice; If mp =-1 then sep = entryPrice;
// Okay initially you want a X point stop and then pull the stop up // or down once price exceeds a multiple of Y points // longMult keeps track of the number of Y point multiples of profit // always key off of lep(LONG ENTRY POINT) // notice how I used + 1 to determine profit // and - 1 to determine stop level
If mp = 1 then Begin If h >= lep + (longMult + 1) * ratchetAmt then longMult = longMult + 1; Sell("LongTrail") next bar at (lep + (longMult - 1) * trailAmt) stop; end;
If mp = -1 then Begin If l <= sep - (shortMult + 1) * ratchetAmt then shortMult = shortMult + 1; buyToCover("ShortTrail") next bar (sep - (shortMult - 1) * trailAmt) stop; end;
Daily Bar Ratchet System
This code is fairly simple. The intriguing inputs are:
volBase[True of False] and volCalcLen [numeric Value]
dollarBase [True of False] and dollarAmt [numeric Value]
devBase [True of False] and devAmt [numeric Value]
If volBase is true then you use the parameters that go along with that scheme. The same goes for the other schemes. So when you run this you would turn one scheme on at a time and set the parameters accordingly. if I wanted to use dollarBase(True) then I would set the dollarAmt to a $ value. The ratcheting mechanism is the same as it was in the prior post so I refer you back to that one for further explanation.
So this was a pretty straightforward strategy. Let us plan out our optimization search space based on the different ranges for each scheme. Since each scheme uses a different calculation we can’t simply optimize across all of the different ranges – one is days, and the other two are dollars and percentages.
Enumerate
We know how to make TradeStation loop based on the range of a value. If you want to optimize from $250 to $1000 in steps of $250, you know this involves [$1000 – $250] / $250 + 1 or 3 + 1 or 4 interations. Four loops will cover this entire search space. Let’s examine the search space for each scheme:
ATR Scheme: start at 10 bars and end at 40 by steps of 2 or [40-10]/2 + 1 = 16
$ Amount Scheme: start at $250 and since we have to have 16 iterations [remember # of iterations have to be the same for each scheme] what can we do to use this information? Well if we start $250 and step by $100 we cover the search space $250, $350, $450, $550…$1,750. $250 + 15 x 250. 15 because $250 is iteration 1.
Percentage StdDev Scheme: start at 0.25 and end at 0.25 + 15 x 0.25 = 4
So we enumerate 16 iterations to a different value. The easiest way to do this is to create a map. I know this seems to be getting hairy but it really isn’t. The map will be defined as an array with 16 elements. The array will be filled with the search space based on which scheme is currently being tested. Take a look at this code where I show how to define an array of 16 elements and introduce my Switch/Case construct.
array: optVals[16](0);

switch(switchMode)
begin
	case 1:
		startPoint = 10; // vol based
		increment = 2;
	case 2:
		startPoint = 250/bigPointValue; // $ based
		increment = 100/bigPointValue;
	case 3:
		startPoint = 0.25; //standard dev
		increment = 0.25*minMove/priceScale;
	default:
		startPoint = 1;
		increment = 1;
end;

vars: cnt(0),loopCnt(0);
once
begin
	for cnt = 1 to 16
	begin
		optVals[cnt] = startPoint + (cnt-1) * increment;
	end;
end
Set Up Complete Search Space for all Three Schemes
This code creates a 16 element array, optVals, and assigns 0 to each element. SwitchMode goes from 1 to 3.
if switchMode is 1: ATR scheme [case: 1] the startPoint is set to 10 and increment is set to 2
if switchMode is 2: $ Amt scheme [case: 2] the startPoint is set to $250 and increment is set to $100
if switchMode is 3: Percentage of StdDev [case: 3] the startPoint is set to 0.25 and the increment is set to 0.25
Once these two values are set the following 15 values can be spawned by the these two. A for loop is great for populating our search space. Notice I wrap this code with ONCE – remember ONCE is only executed at the very beginning of each iteration or run.
once begin for cnt = 1 to 16 begin optVals[cnt] = startPoint + (cnt-1) * increment; end; end
Based on startPoint and increment the entire search space is filled out. Now all you have to do is extract this information stored in the array based on the iteration number.
if c crosses over highest(c[1],20) then buy next bar at open; if c crosses under lowest(c[1],20) then sellshort next bar at open;
mp = marketPosition; if mp <> 0 and mp[1] <> mp then begin longMult = 0; shortMult = 0; end;
If mp = 1 then lep = entryPrice; If mp =-1 then sep = entryPrice;
// Okay initially you want a X point stop and then pull the stop up // or down once price exceeds a multiple of Y points // longMult keeps track of the number of Y point multiples of profit // always key off of lep(LONG ENTRY POINT) // notice how I used + 1 to determine profit // and - 1 to determine stop level
If mp = 1 then Begin If h >= lep + (longMult + 1) * ratchetAmt then longMult = longMult + 1; Sell("LongTrail") next bar at (lep + (longMult - 1) * trailAmt) stop; end;
If mp = -1 then Begin If l <= sep - (shortMult + 1) * ratchetAmt then shortMult = shortMult + 1; buyToCover("ShortTrail") next bar (sep - (shortMult - 1) * trailAmt) stop; end;
Extract Search Space Values and Rest of Code
Switch(switchMode) Begin Case 1: ratchetAmt = avgTrueRange(optVals[optLoops])ratchetMult; trailAmt = avgTrueRange(optVals[optLoops]) trailMult; Case 2: ratchetAmt =optVals[optLoops] * ratchetMult; trailAmt = optVals[optLoops] * trailMult; Case 3: ratchetAmt =stddev(c,20)optVals[optLoops] ratchetMult; trailAmt = stddev(c,20) * optVals[optLoops] * trailMult;
Notice how the optVals are indexed by optLoops. So the only variable that is optimized is the optLoops and it spans 1 through 16. This is the power of enumerations – each number represents a different thing and this is how you can control which variables are optimized in terms of another optimized variable. Here is my optimization specifications:
Opimization space
And here are the results:
Optimization Results
The best combination was scheme 1 [N-day ATR Calculation] using a 2 Mult Ratchet and 1 Mult Trail Trigger. The best N-day was optVals[2] for this scheme. What in the world is this value? Well you will need to back engineer a little bit here. The starting point for this scheme was 10 and the increment was 2 so if optVals[1] =10 then optVals[2] = 12 or ATR(12). You can also print out a map of the search spaces.
vars: cnt(0),loopCnt(0);
once
begin
	loopCnt = loopCnt + 1;
//	print(switchMode," : ",d," ",startPoint);
//	print("  ",loopCnt:2:0,"  --------------------");
	for cnt = 1 to 16
	begin
		optVals[cnt] = startPoint + (cnt-1) * increment;
//		print(cnt," ",optVals[cnt]," ",cnt-1);
	end;
end;
This was a elaborate post so please email me with questions. I wanted to demonstrate that we can accomplish very sophisticated things with just the pure and raw EasyLanguage which is a programming language itself.
A reader of this blog wanted a conversion from my Ratchet Trailing Stop indicator into a Strategy. You will notice a very close similarity with the indicator code as the code for this strategy. This is a simple N-Bar [Hi/Lo] break out with inputs for the RatchetAmt and TrailAmt. Remember RatchetAmt is how far the market must move in your favor before the stop is pulldown the TrailAmt. So if the RatchetAmt is 12 and the TrailAmt is 6, the market would need to move 12 handles in your favor and the Trail Stop would move to break even. If it moves another 12 handles then the stop would be moved up/down by 6 handles. Let me know if you have any questions – this system is similar to the one I just posted.
Notice how the RED line Ratchets Up by the Fixed Amount [8/6]
If d <> d[1] then Begin longMult = 0; shortMult = 0; myBarCount = 0; mp = 0; lep = 0; sep = 0; buysToday = 0; shortsToday = 0; end;
myBarCount = myBarCount + 1;
If myBarCount = 6 then // six 5 min bars = 30 minutes Begin stb = highD(0); //get the high of the day sts = lowD(0); //get low of the day end;
If myBarCount >=6 and t < calcTime(sess1Endtime,-3*barInterval) then Begin if buysToday = 0 then buy("NBar-Range-B") next bar stb stop; if shortsToday = 0 then sellShort("NBar-Range-S") next bar sts stop; end;
mp = marketPosition; If mp = 1 then begin lep = entryPrice; buysToday = 1; end; If mp =-1 then begin sep = entryPrice; shortsToday = 1; end;
// Okay initially you want a X point stop and then pull the stop up // or down once price exceeds a multiple of Y points // longMult keeps track of the number of Y point multipes of profit // always key off of lep(LONG ENTRY POINT) // notice how I used + 1 to determine profit // and - 1 to determine stop level
If mp = 1 then Begin If h >= lep + (longMult + 1) * ratchetAmt then longMult = longMult + 1; Sell("LongTrail") next bar at (lep + (longMult - 1) * trailAmt) stop; end;
If mp = -1 then Begin If l <= sep - (shortMult + 1) * ratchetAmt then shortMult = shortMult + 1; buyToCover("ShortTrail") next bar (sep - (shortMult - 1) * trailAmt) stop; end;
setExitOnClose;
I Used my Ratchet Indicator for the Basis of this Strategy
What is Better: 30, 60, or 120 Minute Break-Out on ES.D
Here is a simple tutorial you can use as a foundation to build a potentially profitable day trading system. Here we wait N minutes after the open and then buy the high of the day or short the low of the day and apply a protective stop and profit objective. The time increment can be optimized to see what time frame is best to use. You can also optimize the stop loss and profit objective – this system gets out at the end of the day. This system can be applied to any .D data stream in TradeStation or Multicharts.
Logic Description
get open time
get close time
get N time increment
15 – first 15 minute of day
30 – first 30 minute of day
60 – first hour of day
get High and Low of day
place stop orders at high and low of day – no entries late in day
calculate buy and short entries – only allow one each*
apply stop loss
apply profit objective
get out at end of day if not exits have occurred
Optimization Results [From 15 to 120 by 5 minutes] on @ES.D 5 Minute Chart – Over Last Two Years
Optimization of Time: Look How the # Trades Decrease as the Time Increment Increases
Simple Orbo EasyLanguage
I threw this together rather quickly in a response to a reader’s question. Let me know if you see a bug or two. Remember once you gather your stops you must allow the order to be issued on every subsequent bar of the trading day. The trading day is defined to be the time between timeIncrement and endTradeMinB4Close. Notice how I used the EL function calcTime to calculate time using either a +positive or -negative input. I want to sample the high/low of the day at timeIncrement and want to trade up until endTradeMinB4Close time. I use the HighD and LowD functions to extract the high and low of the day up to that point. Since I am using a tight stop relative to today’s volatility you will see more than 1 buy or 1 short occurring. This happens when entry/exit occurs on the same bar and MP is not updated accordingly. Somewhere hidden in this tome of a blog you will see a solution for this. If you don’t want to search I will repost it tomorrow.
//Optimizing Time to determine a simple break out //Only works on .D data streams Inputs: timeIncrement(15),endTradeMinB4Close(-15),stopLoss$(500),profTarg$(1000);
If time = calcStopTime then begin buyStop = HighD(0); shortStop = LowD(0); buysToday = 0; shortsToday = 0; End;
if time >= calcStopTime and time < quitTradeTime then begin if buysToday = 0 then Buy next bar at buyStop stop; if shortsToday = 0 then Sell short next bar at shortStop stop; end;
mp = marketPosition;
If mp = 1 then buysToday = 1; If mp = -1 then shortsToday = 1;
I was recently testing the idea of a short term VBO strategy on the ES utilizing very tight stops. I wanted to see if using a tight ATR stop in concert with the entry day’s low (for buys) would cut down on losses after a break out. In other words, if the break out doesn’t go as anticipated get out and wait for the next signal. With the benefit of hindsight in writing this post, I certainly felt like my exit mechanism was what was going to make or break this system. In turns out that all pre conceived notions should be thrown out when volatility enters the picture.
System Description
If 14 ADX < 20 get ready to trade
Buy 1 ATR above the midPoint of the past 4 closing prices
Place an initial stop at 1 ATR and a Profit Objective of 1 ATR
Trail the stop up to the prior day’s low if it is greater than entryPrice – 1 ATR initially, and then trail if a higher low is established
Wait 3 bars to Re-Enter after going flat – Reversals allowed
That’s it. Basically wait for a trendless period and buy on the bulge and then get it out if it doesn’t materialize. I knew I could improve the system by optimizing the parameters but I felt I was in the ball park. My hypothesis was that the system would fail because of the tight stops. I felt the ADX trigger was OK and the BO level would get in on a short burst. Just from past experience I knew that using the prior day’s price extremes as a stop usually doesn’t fair that well.
Without commission the initial test was a loser: -$1K and -$20K draw down over the past ten years. I thought I would test my hypothesis by optimizing a majority of the parameters:
ADX Len
ADX Trigger Value
ATR Len
ATR BO multiplier
ATR Multiplier for Trade Risk
ATR Multiplier for Profit Objective
Number of bars to trail the stop – used lowest lows for longs
Results
As you can probably figure, I had to use the Genetic Optimizer to get the job done. Over a billion different permutations. In the end here is what the computer pushed out using the best set of parameters.
No Commission or Slippage – Genetic Optimized Parameter Selection
Optimization Report – The Best of the Best
Top Parameters – notice the Wide Stop Initially and the Trailing Stop Look-Back and also the Profit Multiplier – but what really sticks out is the ADX inputs
ADX – Does it Really Matter?
Take a look at the chart – the ADX is mostly in Trigger territory – does it really matter?
A Chart is Worth a 1000 Words
What does this chart tell us?
70% of Profit was made in last 40 trades
Was the parameter selection biased by the heightened level of volatility? The system has performed on the parameter set very well over the past two or three years. But should you use this parameter set going into the future – volatility will eventually settle down.
Now using my experience in trading I would have selected a different parameter set. Here are my biased results going into the initial programming. I would use a wider stop for sure, but I would have used the generic ADX values.
George’s More Common Sense Parameter Selection – wow big difference
I would have used 14 ADX Len with a 20 trigger and risk 1 to make 3 and use a wider trailing stop. With trend neutral break out algorithms, it seems you have to be in the game all of the time. The ADX was supposed to capture zones that predicated break out moves, but the ADX didn’t help out at all. Wider stops helped but it was the ADX values that really changed the complexion of the system. Also the number of bars to wait after going flat had a large impact as well. During low volatility you can be somewhat picky with trades but when volatility increases you gots to be in the game. – no ADX filtering and no delay in re-Entry. Surprise, surprise!
Alogorithm Code
Here is the code – some neat stuff here if you are just learning EL. Notice how I anchor some of the indicator based variables by indexing them by barsSinceEntry. Drop me a note if you see something wrong or want a little further explanation.
If mp <> 1 and adx(adxLen) < adxTrig and BSE > reEntryDelay and open of next bar < BBO then buy next bar at BBO stop; If mp <>-1 and adx(adxLen) < adxTrig AND BSE > reEntryDelay AND open of next bar > SBO then sellshort next bar at SBO stop;
If mp = 1 and mp[1] <> 1 then Begin trailLongStop = entryPrice - tradeRisk; end;
If mp = -1 and mp[1] <> -1 then Begin trailShortStop = entryPrice + tradeRisk; end;
if mp = 1 then sell("L-init-loss") next bar at entryPrice - tradeRisk[barsSinceEntry] stop; if mp = -1 then buyToCover("S-init-loss") next bar at entryPrice + tradeRisk[barsSinceEntry] stop;
if mp = 1 then begin sell("L-ATR-prof") next bar at entryPrice + tradeProf[barsSinceEntry] limit; trailLongStop = maxList(trailLongStop,lowest(l,posMovTrailNumBars)); sell("L-TL-Stop") next bar at trailLongStop stop; end; if mp =-1 then begin buyToCover("S-ATR-prof") next bar at entryPrice -tradeProf[barsSinceEntry] limit; trailShortStop = minList(trailShortStop,highest(h,posMovTrailNumBars)); // print(d, " Short and trailStop is : ",trailShortStop); buyToCover("S-TL-Stop") next bar at trailShortStop stop; end;
Backtesting with [Trade Station,Python,AmiBroker, Excel]. Intended for informational and educational purposes only!
Get All Five Books in the Easing Into EasyLanguage Series - The Trend Following Edition is now Available!
Announcement – A Trend Following edition has been added to my Easing into EasyLanguage Series! This edition will be the fifth and final installment and will utilize concepts discussed in the Foundation editions. I will pay respect to the legends of Trend Following by replicating the essence of their algorithms. Learn about the most prominent form of algorithmic trading. But get geared up for it by reading the first four editions in the series now. Get your favorite QUANT the books they need!
The Foundation Edition. The first in the series.
This series includes five editions that covers the full spectrum of the EasyLanguage programming language. Fully compliant with TradeStation and mostly compliant with MultiCharts. Start out with the Foundation Edition. It is designed for the new user of EasyLanguage or for those you would like to have a refresher course. There are 13 tutorials ranging from creating Strategies to PaintBars. Learn how to create your own functions or apply stops and profit objectives. Ever wanted to know how to find an inside day that is also a Narrow Range 7 (NR7?) Now you can, and the best part is you get over 4 HOURS OF VIDEO INSTRUCTION – one for each tutorial.
Hi-Res Edition Cover
This book is ideal for those who have completed the Foundation Edition or have some experience with EasyLanguage, especially if you’re ready to take your programming skills to the next level. The Hi-Res Edition is designed for programmers who want to build intraday trading systems, incorporating trade management techniques like profit targets and stop losses. This edition bridges the gap between daily and intraday bar programming, making it easier to handle challenges like tracking the sequence of high and low prices within the trading day. Plus, enjoy 5 hours of video instruction to guide you through each tutorial.
Advanced Topics Cover
The Advanced Topics Edition delves into essential programming concepts within EasyLanguage, offering a focused approach to complex topics. This book covers arrays and fixed-length buffers, including methods for element management, extraction, and sorting. Explore finite state machines using the switch-case construct, text graphic manipulation to retrieve precise X and Y coordinates, and gain insights into seasonality with the Ruggiero/Barna Universal Seasonal and Sheldon Knight Seasonal methods. Additionally, learn to build EasyLanguage projects, integrate fundamental data like Commitment of Traders, and create multi-timeframe indicators for comprehensive analysis.
Get Day Trading Edition Today!
The Day Trading Edition complements the other books in the series, diving into the popular approach of day trading, where overnight risk is avoided (though daytime risk still applies!). Programming on high-resolution data, such as five- or one-minute bars, can be challenging, and this book provides guidance without claiming to be a “Holy Grail.” It’s not for ultra-high-frequency trading but rather for those interested in techniques like volatility-based breakouts, pyramiding, scaling out, and zone-based trading. Ideal for readers of the Foundation and Hi-Res editions or those with EasyLanguage experience, this book offers insights into algorithms that shaped the day trading industry.
Trend Following Cover.
For thirty-one years as the Director of Research at Futures Truth Magazine, I had the privilege of collaborating with renowned experts in technical analysis, including Fitschen, Stuckey, Ruggiero, Fox, and Waite. I gained invaluable insights as I watched their trend-following methods reach impressive peaks, face sharp declines, and ultimately rebound. From late 2014 to early 2020, I witnessed a dramatic downturn across the trend-following industry. Iconic systems like Aberration, CatScan, Andromeda, and Super Turtle—once thriving on robust trends of the 1990s through early 2010s—began to falter long before the pandemic. Since 2020 we have seen the familiar trends return. Get six hours of video instruction with this edition.
Pick up your copies today – e-Book or paperback format – at Amazon.com